
Field Notes
<--2014-08-05 09:40:00 | 2014-08-21 10:30:00-->Other sites visited today: Vaira | Tonzi
Phenocam link: Searching...
Tonzi: 2014-08-21 09:00:00 (DOY 233)
Author: Siyan Ma
Others: Joe
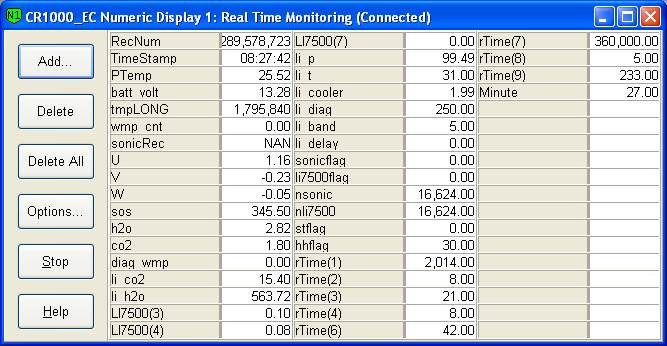
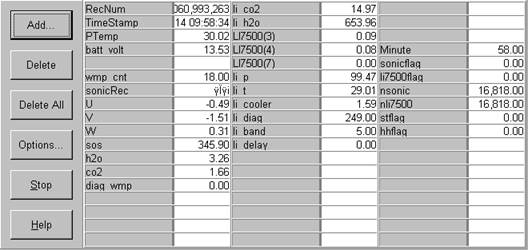
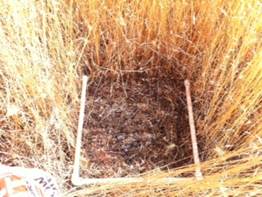
Summary: Standard field work, co2 profile system down - IGRA brought it, midday water potential, litter biomass.
|
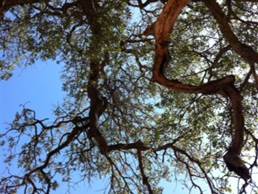
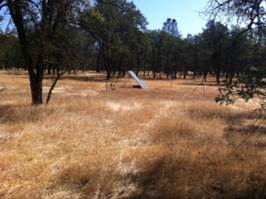
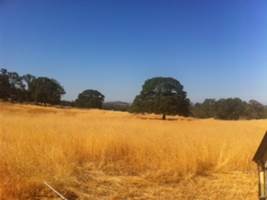
When: Date: 8/21/2014 , Day: 232 , Watch Time: 9:00 am . Where: Tonzi/Vaira Ranch Who: Siyan, Joe Weather: clear, sunny, nice breeze Phenology: golden grasses
Summary
Vaira_Grass Site
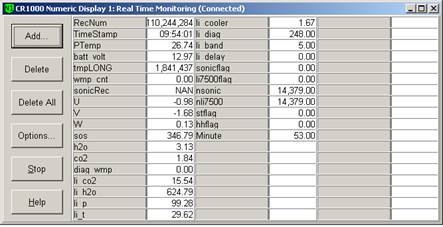
   Tonzi_Tower Site
IRGA gave unreasonable readings. Joe cleaned it in the field, but readings were still bad. At last, Joe took off the IRGA and brought it back to the lab. 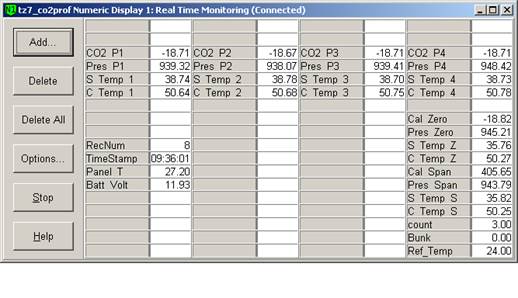 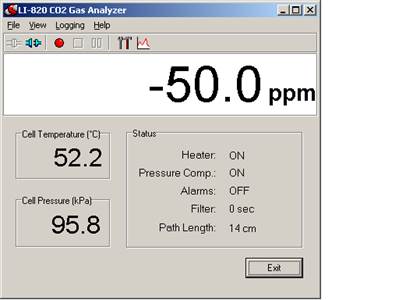 9. closed gate and set up fence. YES! Toniz_Floor Site
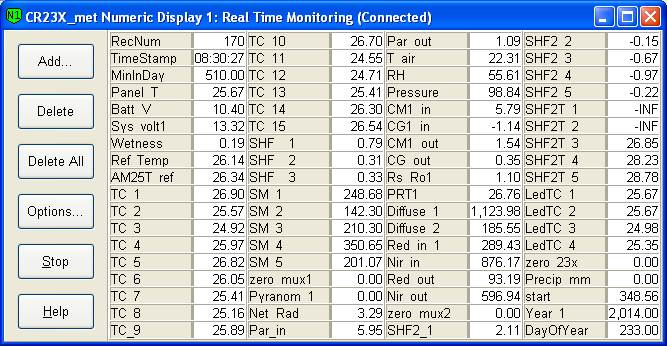
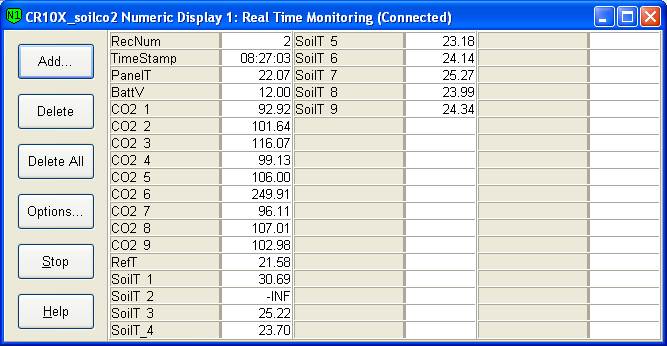
CR23X3 – floor-Met CR23X6 – tower-Met CR10X2 – floor-Met Soil CO2 profile: CR23X5 – soil CO2 profile 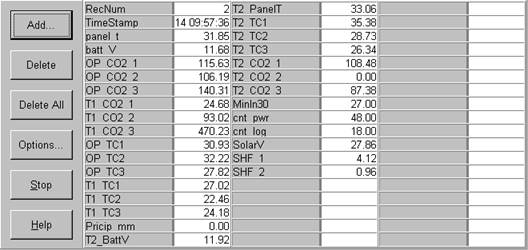 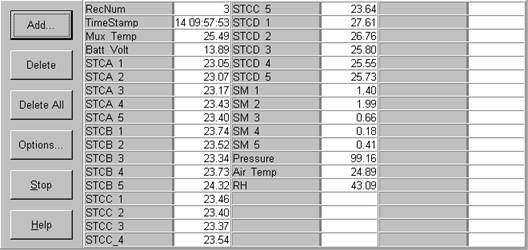 
|
Field Data
No tank data
Well Depth
| Date | Location | Depth (feet) |
|---|---|---|
| 2014-08-21 | TZ_floor | 32.4 |
| 2014-08-21 | TZ_road | 39.3 |
| 2014-08-21 | TZ_tower | 35.6 |
mode = both
Moisture Point Probes TZ
Array
(
[0] => Tower_1
[1] => Floor_South_1
[2] => Floor_East_1
[3] => Floor_West_1
[4] => Soil_Transect_4_1
[5] => Soil_Transect_1_1
[6] => SoilCO2_West_A_1
[7] => SoilCO2_West_B_1
[8] => SoilCO2_West_C_1
[9] => Tower_2
[10] => Floor_South_2
[11] => Floor_East_2
[12] => Floor_West_2
[13] => SoilCO2_2
[14] => Soil_Transect_4_2
[15] => Soil_Transect_3_2
[16] => Soil_Transect_2_2
[17] => Soil_Transect_1_2
[18] => SoilCO2_West_A_2
[19] => SoilCO2_West_B_2
[20] => SoilCO2_West_C_2
[21] => Tower_3
[22] => Floor_South_3
[23] => Floor_West_3
[24] => SoilCO2_3
[25] => Soil_Transect_4_3
[26] => Soil_Transect_3_3
[27] => Soil_Transect_2_3
[28] => Soil_Transect_1_3
[29] => SoilCO2_West_A_3
[30] => SoilCO2_West_B_3
[31] => SoilCO2_West_C_3
[32] => Floor_South_4
[33] => Floor_West_4
[34] => SoilCO2_4
[35] => Soil_Transect_4_4
[36] => Soil_Transect_3_4
[37] => Soil_Transect_2_4
[38] => Soil_Transect_1_4
[39] => SoilCO2_West_A_4
[40] => SoilCO2_West_B_4
[41] => SoilCO2_West_C_4
[42] => SoilCO2_1
[43] => Soil_Transect_3_1
)
| Date | DOY | Rep | Depth | Tower_1 |
Floor_South_1 |
Floor_East_1 |
Floor_West_1 |
Soil_Transect_4_1 |
Soil_Transect_1_1 |
SoilCO2_West_A_1 |
SoilCO2_West_B_1 |
SoilCO2_West_C_1 |
Tower_2 |
Floor_South_2 |
Floor_East_2 |
Floor_West_2 |
SoilCO2_2 |
Soil_Transect_4_2 |
Soil_Transect_3_2 |
Soil_Transect_2_2 |
Soil_Transect_1_2 |
SoilCO2_West_A_2 |
SoilCO2_West_B_2 |
SoilCO2_West_C_2 |
Tower_3 |
Floor_South_3 |
Floor_West_3 |
SoilCO2_3 |
Soil_Transect_4_3 |
Soil_Transect_3_3 |
Soil_Transect_2_3 |
Soil_Transect_1_3 |
SoilCO2_West_A_3 |
SoilCO2_West_B_3 |
SoilCO2_West_C_3 |
Floor_South_4 |
Floor_West_4 |
SoilCO2_4 |
Soil_Transect_4_4 |
Soil_Transect_3_4 |
Soil_Transect_2_4 |
Soil_Transect_1_4 |
SoilCO2_West_A_4 |
SoilCO2_West_B_4 |
SoilCO2_West_C_4 |
SoilCO2_1 |
Soil_Transect_3_1 |
Avg | Spacial Count |
Measurement Count |
|---|---|---|---|---|---|---|---|---|---|---|---|---|---|---|---|---|---|---|---|---|---|---|---|---|---|---|---|---|---|---|---|---|---|---|---|---|---|---|---|---|---|---|---|---|---|---|---|---|---|---|
| 2014-08-21 | 233 | 0 | nan | 7.1 | 0.6 | 3.6 | 4.7 | 0.1 | 1.5 | 7.7 | 1.5 | 3.6 | 10.5 | 10 | 11.2 | 8.1 | 6 | 9 | 14.5 | 12.2 | 2.9 | 15.4 | 0.6 | 8.4 | 17.9 | 10.3 | 22.6 | 12.9 | 9.5 | 11.1 | 16.5 | 13.1 | 17.8 | 15.4 | 11.1 | 8.5 | 11.1 | 11.1 | 11 | 25.9 | 18.5 | 10.5 | 17.6 | 11.5 | 19.3 | |||||
| 2014-08-21 | 233 | 1 | nan | 8.3 | 1.2 | 0.4 | 1.8 | 7.1 | 2.4 | 5.3 | 10 | 10 | 8.4 | 5.7 | 9 | 15.2 | 11.5 | 2.9 | 6.6 | 0.5 | 7.8 | 18.4 | 10.9 | 14.3 | 14.3 | 9.5 | 15.6 | 15.9 | 12.9 | 14.3 | 15.7 | 11.1 | 8.2 | 11.1 | 10.2 | 14.8 | 18.5 | 9.9 | 17.3 | 11.9 | 20.2 | 11.1 | 6.5 | |||||||
| 2014-08-21 | 233 | Avg | 0-15cm | 0 | 0 | |||||||||||||||||||||||||||||||||||||||||||||
| 2014-08-21 | 233 | Avg | 15-30cm | 0 | 0 | |||||||||||||||||||||||||||||||||||||||||||||
| 2014-08-21 | 233 | Avg | 30-45cm | 0 | 0 | |||||||||||||||||||||||||||||||||||||||||||||
| 2014-08-21 | 233 | Avg | 45-60cm | 0 | 0 |
mode = both
Moisture Point Probes VR
Array
(
[0] => Solar_Panels_1
[1] => Flux_Tower_1
[2] => Gate_1
[3] => Biomass_Cage_1
[4] => Solar_Panels_2
[5] => Flux_Tower_2
[6] => Gate_2
[7] => Biomass_Cage_2
[8] => Solar_Panels_3
[9] => Flux_Tower_3
[10] => Gate_3
[11] => Biomass_Cage_3
[12] => Solar_Panels_4
[13] => Flux_Tower_4
[14] => Gate_4
[15] => Biomass_Cage_4
)
| Date | DOY | Rep | Depth | Solar_Panels_1 |
Flux_Tower_1 |
Gate_1 |
Biomass_Cage_1 |
Solar_Panels_2 |
Flux_Tower_2 |
Gate_2 |
Biomass_Cage_2 |
Solar_Panels_3 |
Flux_Tower_3 |
Gate_3 |
Biomass_Cage_3 |
Solar_Panels_4 |
Flux_Tower_4 |
Gate_4 |
Biomass_Cage_4 |
Avg | Spacial Count |
Measurement Count |
|---|---|---|---|---|---|---|---|---|---|---|---|---|---|---|---|---|---|---|---|---|---|---|
| 2014-08-21 | 233 | 0 | nan | 0.4 | 1.5 | 1.6 | 0.7 | 8.4 | 5.1 | 10 | 2.9 | 14 | 3.4 | 15.4 | 12 | 27.9 | 11 | 6.4 | 14.8 | |||
| 2014-08-21 | 233 | 1 | nan | 0.4 | 2.1 | 0.1 | 8.1 | 5.7 | 2.6 | 13.7 | 3.1 | 11.2 | 28.2 | 11 | 15.3 | |||||||
| 2014-08-21 | 233 | Avg | 0-15cm | 0 | 0 | |||||||||||||||||
| 2014-08-21 | 233 | Avg | 15-30cm | 0 | 0 | |||||||||||||||||
| 2014-08-21 | 233 | Avg | 30-45cm | 0 | 0 | |||||||||||||||||
| 2014-08-21 | 233 | Avg | 45-60cm | 0 | 0 |
No TZ grass heigth found
No VR grass heigth found
Tree DBH
| Date | Tag# | Reading (mm) |
|---|---|---|
| 2014-08-21 | 1 | 5.9 |
| 2014-08-21 | 102 | 5.0 |
| 2014-08-21 | 2 | 10.3 |
| 2014-08-21 | 245 | 17.9 |
| 2014-08-21 | 3 | 8.1 |
| 2014-08-21 | 4 | 9.0 |
| 2014-08-21 | 5 | 9.3 |
| 2014-08-21 | 7 | 8.4 |
| 2014-08-21 | 72 | 17.6 |
| 2014-08-21 | 79 | 10.5 |
| 2014-08-21 | 8 | 12.0 |
Water Potential - mode: raw
| Time | Species | Tree | readings (bar) | ||
|---|---|---|---|---|---|
| 2014-08-21 12:27:00 | OAK | 102 | -30 | ||
| 2014-08-21 12:27:00 | OAK | 35 | -30 | ||
| 2014-08-21 12:27:00 | OAK | 92 | -25 | ||
| 2014-08-21 12:34:00 | PINE | OLD | -35 | -20 | -19 |
| 2014-08-21 12:34:00 | PINE | YNG | -1 | -7 | -7 |
No TZ Grass Biomass data found
No TZ OakLeaves Biomass data found
No TZ PineNeedles Biomass data found
0 photos found
16 sets found
No data found for TZ_Fenergy.
11 TZ_tmet graphs found
11 TZ_soilco2 graphs found
Can't check TZ_mixed
3 TZ_mixed graphs found
1 TZ_fflux graphs found
8 TZ_fmet graphs found
1 TZ_tram graphs found
3 TZ_co2prof graphs found
No data found for TZ_irt.
No data found for TZ_windprof.
1 TZ_tflux graphs found
2 TZ_sm graphs found
Can't check TZ_met
1 TZ_met graphs found
Can't check TZVR_mixed
8 TZ_osu graphs found
No data found for TZ_fd.
Tonzi Z-cam data