
Field Notes
<--2014-07-09 04:50:00 | 2014-08-21 09:00:00-->Phenocam link: Searching...
Tonzi: 2014-08-05 09:40:00 (DOY 217)
Author: Siyan Ma
Others:
Summary: Trees started to change color, did not span co2 profile, tram and co2 profile files need daily split set up.
|
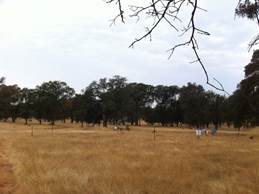
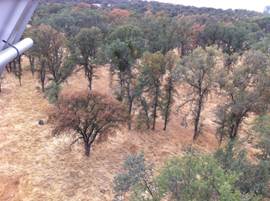
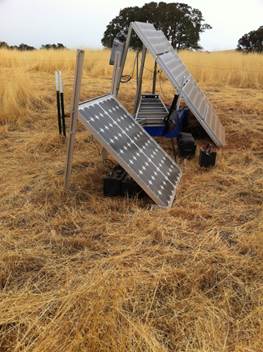
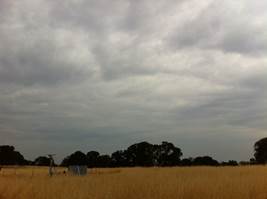
When: Date: 8/5/2014 , Day: 217 , Watch Time: 9:40 am . Where: Tonzi/Vaira Ranch Who: Siyan Weather: very cloudy; not too much wind under the canopy Phenology: golden grasses; oak leaves started change color, 10-20%; some individual trees had 100%.
Summary
Vaira_Grass Site
Tonzi_Tower Site
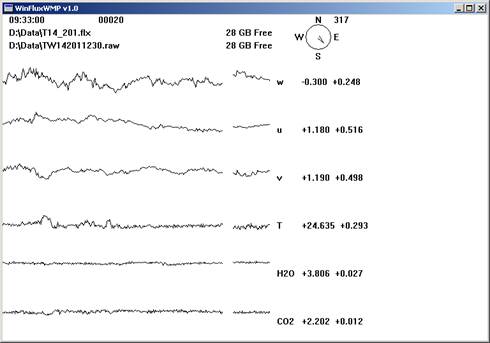
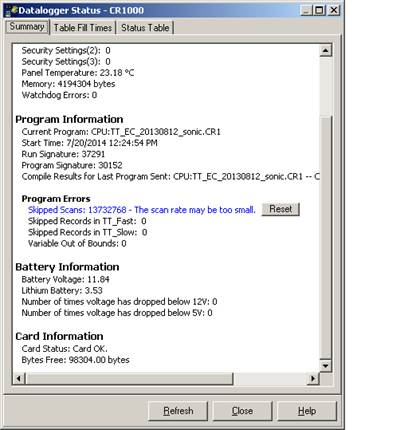
tz7 and tz9 now are two big files; the new PC didn’t split the files into daily file.
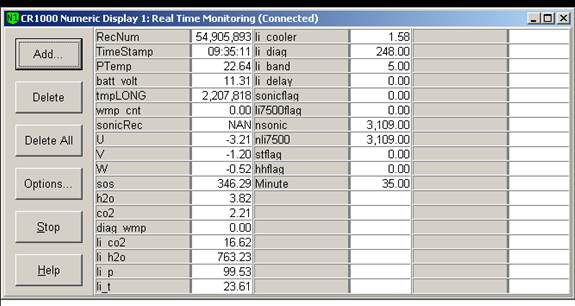
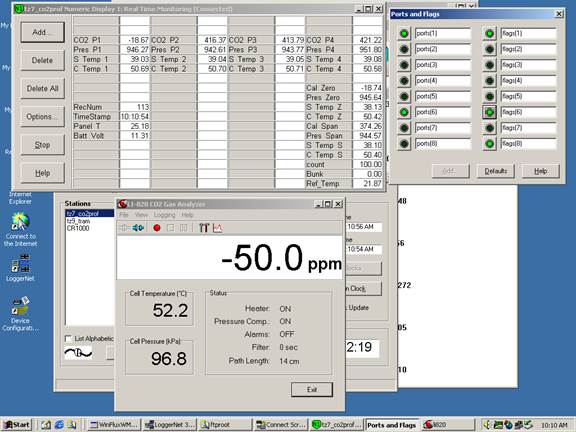
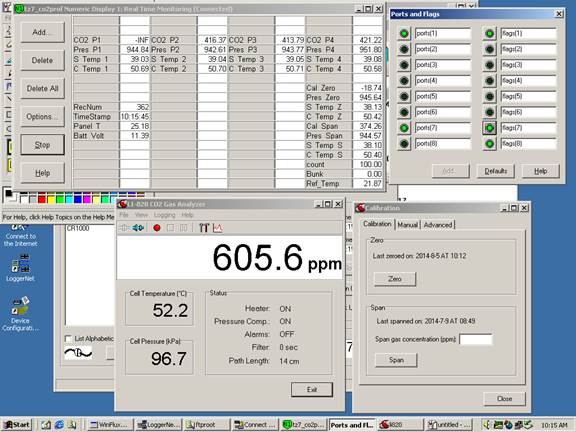
Is the pump running‌ YES! Calibration couldn’t complete because the reading went up to 600pm when span button was on. Zero was OK, though. 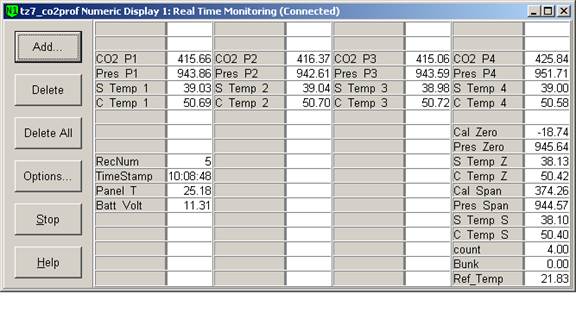
9. closed gate and set up fence. YES! Toniz_Floor Site
CR23X3 – floor-Met CR23X6 – tower-Met CR10X2 – floor-Met Soil CO2 profile: CR23X5 – soil CO2 profile (Everything’s working. I forgot copying snapshots this time.)
|
Field Data
CO2 Profile Tanks
| Date | Tank | Pressure (psi) | ppm |
|---|---|---|---|
| 2014-08-05 | CO2 | 1000 | 402.68 |
| 2014-08-05 | N2 | 2000 | 0 |
Well Depth
| Date | Location | Depth (feet) |
|---|---|---|
| 2014-08-05 | TZ_floor | 31 |
| 2014-08-05 | TZ_road | 40 |
| 2014-08-05 | TZ_tower | 35.3 |
mode = both
Moisture Point Probes TZ
Array
(
[0] => Tower_1
[1] => Floor_South_1
[2] => Floor_West_1
[3] => SoilCO2_1
[4] => Soil_Transect_4_1
[5] => Soil_Transect_3_1
[6] => Soil_Transect_2_1
[7] => Soil_Transect_1_1
[8] => SoilCO2_West_A_1
[9] => SoilCO2_West_B_1
[10] => SoilCO2_West_C_1
[11] => Tower_2
[12] => Floor_South_2
[13] => Floor_East_2
[14] => Floor_West_2
[15] => SoilCO2_2
[16] => Soil_Transect_4_2
[17] => Soil_Transect_3_2
[18] => Soil_Transect_2_2
[19] => Soil_Transect_1_2
[20] => SoilCO2_West_A_2
[21] => SoilCO2_West_B_2
[22] => SoilCO2_West_C_2
[23] => Tower_3
[24] => Floor_South_3
[25] => Floor_East_3
[26] => Floor_West_3
[27] => SoilCO2_3
[28] => Soil_Transect_4_3
[29] => Soil_Transect_2_3
[30] => Soil_Transect_1_3
[31] => SoilCO2_West_A_3
[32] => SoilCO2_West_B_3
[33] => SoilCO2_West_C_3
[34] => Floor_South_4
[35] => Floor_East_4
[36] => Floor_West_4
[37] => SoilCO2_4
[38] => Soil_Transect_4_4
[39] => Soil_Transect_3_4
[40] => Soil_Transect_2_4
[41] => Soil_Transect_1_4
[42] => SoilCO2_West_A_4
[43] => SoilCO2_West_B_4
)
| Date | DOY | Rep | Depth | Tower_1 |
Floor_South_1 |
Floor_West_1 |
SoilCO2_1 |
Soil_Transect_4_1 |
Soil_Transect_3_1 |
Soil_Transect_2_1 |
Soil_Transect_1_1 |
SoilCO2_West_A_1 |
SoilCO2_West_B_1 |
SoilCO2_West_C_1 |
Tower_2 |
Floor_South_2 |
Floor_East_2 |
Floor_West_2 |
SoilCO2_2 |
Soil_Transect_4_2 |
Soil_Transect_3_2 |
Soil_Transect_2_2 |
Soil_Transect_1_2 |
SoilCO2_West_A_2 |
SoilCO2_West_B_2 |
SoilCO2_West_C_2 |
Tower_3 |
Floor_South_3 |
Floor_East_3 |
Floor_West_3 |
SoilCO2_3 |
Soil_Transect_4_3 |
Soil_Transect_2_3 |
Soil_Transect_1_3 |
SoilCO2_West_A_3 |
SoilCO2_West_B_3 |
SoilCO2_West_C_3 |
Floor_South_4 |
Floor_East_4 |
Floor_West_4 |
SoilCO2_4 |
Soil_Transect_4_4 |
Soil_Transect_3_4 |
Soil_Transect_2_4 |
Soil_Transect_1_4 |
SoilCO2_West_A_4 |
SoilCO2_West_B_4 |
Avg | Spacial Count |
Measurement Count |
|---|---|---|---|---|---|---|---|---|---|---|---|---|---|---|---|---|---|---|---|---|---|---|---|---|---|---|---|---|---|---|---|---|---|---|---|---|---|---|---|---|---|---|---|---|---|---|---|---|---|---|
| 2014-08-05 | 217 | 0 | nan | 7.4 | 1.8 | 4.2 | 8.3 | 2.4 | 15.6 | 0.6 | 3.9 | 1.9 | 2.1 | 11.1 | 9 | 11.2 | 13.9 | 8.1 | 6 | 9.7 | 13.6 | 12.4 | 4.8 | 6.3 | 10.3 | 12.7 | 17.6 | 10.6 | 14.3 | 22.1 | 4.2 | 9.5 | 17 | 13.1 | 15.9 | 15.9 | 13.4 | 4.2 | 19.9 | 11.1 | 17.3 | 11 | 6.4 | 19.9 | 11.3 | 17.9 | 12.5 | |||
| 2014-08-05 | 217 | 1 | nan | 8.3 | 2.1 | 6.2 | 3.9 | 10.3 | 11.2 | 13.6 | 8.4 | 15.2 | 17 | 10.3 | 12 | 22.1 | 14.8 | 4.4 | 20.2 | 11.1 | ||||||||||||||||||||||||||||||
| 2014-08-05 | 217 | 2 | nan | 8.1 | 1.6 | 17.6 | ||||||||||||||||||||||||||||||||||||||||||||
| 2014-08-05 | 217 | Avg | 0-15cm | 0 | 0 | |||||||||||||||||||||||||||||||||||||||||||||
| 2014-08-05 | 217 | Avg | 15-30cm | 0 | 0 | |||||||||||||||||||||||||||||||||||||||||||||
| 2014-08-05 | 217 | Avg | 30-45cm | 0 | 0 | |||||||||||||||||||||||||||||||||||||||||||||
| 2014-08-05 | 217 | Avg | 45-60cm | 0 | 0 |
mode = both
Moisture Point Probes VR
Array
(
[0] => Solar_Panels_1
[1] => Flux_Tower_1
[2] => Gate_1
[3] => Biomass_Cage_1
[4] => Solar_Panels_2
[5] => Flux_Tower_2
[6] => Gate_2
[7] => Biomass_Cage_2
[8] => Solar_Panels_3
[9] => Flux_Tower_3
[10] => Gate_3
[11] => Biomass_Cage_3
[12] => Solar_Panels_4
[13] => Flux_Tower_4
[14] => Gate_4
[15] => Biomass_Cage_4
)
| Date | DOY | Rep | Depth | Solar_Panels_1 |
Flux_Tower_1 |
Gate_1 |
Biomass_Cage_1 |
Solar_Panels_2 |
Flux_Tower_2 |
Gate_2 |
Biomass_Cage_2 |
Solar_Panels_3 |
Flux_Tower_3 |
Gate_3 |
Biomass_Cage_3 |
Solar_Panels_4 |
Flux_Tower_4 |
Gate_4 |
Biomass_Cage_4 |
Avg | Spacial Count |
Measurement Count |
|---|---|---|---|---|---|---|---|---|---|---|---|---|---|---|---|---|---|---|---|---|---|---|
| 2014-08-05 | 217 | 0 | nan | 0.1 | 2.1 | 3 | 0.1 | 8.4 | 4.9 | 13.9 | 2.9 | 13.1 | 3.7 | 17 | 10.9 | 27.9 | 11.9 | 11.1 | 14.8 | |||
| 2014-08-05 | 217 | 1 | nan | 2.7 | 9 | 16.8 | 10.7 | |||||||||||||||
| 2014-08-05 | 217 | Avg | 0-15cm | 0 | 0 | |||||||||||||||||
| 2014-08-05 | 217 | Avg | 15-30cm | 0 | 0 | |||||||||||||||||
| 2014-08-05 | 217 | Avg | 30-45cm | 0 | 0 | |||||||||||||||||
| 2014-08-05 | 217 | Avg | 45-60cm | 0 | 0 |
No TZ grass heigth found
No VR grass heigth found
Tree DBH
| Date | Tag# | Reading (mm) |
|---|---|---|
| 2014-08-05 | 1 | 6.2 |
| 2014-08-05 | 102 | 5.0 |
| 2014-08-05 | 2 | 10.5 |
| 2014-08-05 | 245 | 17.5 |
| 2014-08-05 | 3 | 8.2 |
| 2014-08-05 | 4 | 9.5 |
| 2014-08-05 | 5 | 9.4 |
| 2014-08-05 | 7 | 8.3 |
| 2014-08-05 | 72 | 17.6 |
| 2014-08-05 | 79 | 10.8 |
| 2014-08-05 | 8 | 12.0 |
Water Potential - mode: raw
| Time | Species | Tree | readings (bar) | ||
|---|---|---|---|---|---|
| 2014-08-05 09:51:00 | OAK | 102 | -24 | -19 | -35 |
| 2014-08-05 09:51:00 | OAK | 35 | -29 | -3 | -20 |
| 2014-08-05 09:51:00 | OAK | 92 | -25 | -22 | -30 |
| 2014-08-05 10:15:00 | PINE | OLD | -20 | -32 | -18 |
| 2014-08-05 10:15:00 | PINE | YNG | -3 | -9 | -4 |
No TZ Grass Biomass data found
No TZ OakLeaves Biomass data found
No TZ PineNeedles Biomass data found
1 photos found

tonzi_2014_08_05_113102.jpg ( 2014-08-05 11:32:36 ) Full size: 1296x960
Site visit
16 sets found
No data found for TZ_Fenergy.
11 TZ_tmet graphs found
11 TZ_soilco2 graphs found
Can't check TZ_mixed
3 TZ_mixed graphs found
1 TZ_fflux graphs found
8 TZ_fmet graphs found
1 TZ_tram graphs found
3 TZ_co2prof graphs found
No data found for TZ_irt.
No data found for TZ_windprof.
1 TZ_tflux graphs found
2 TZ_sm graphs found
Can't check TZ_met
1 TZ_met graphs found
Can't check TZVR_mixed
8 TZ_osu graphs found
No data found for TZ_fd.
Tonzi Z-cam data