Field Notes
<--2013-11-07 09:00:00 | 2014-01-29 14:30:00-->Other sites visited today: Tonzi | Tonzi
Phenocam link: Searching...
Vaira: 2014-01-07 09:00:00 (DOY 7)
Author: Joe Verfaillie
Others: Siyan
Summary: Tested SMS text messaging - not enough signal, standard fieldwork, clipping litter, fixed fence.
| Varia 2014-01-07 I arrived about 9am with Siyan. It was clear, sunny and mild with little to no wind. In areas where there is very sparse litter only a broad leaf herb is still green, most of the new grass has died. But in areas where there still some standing litter the grass and other things are hanging on. I tried to setup the data to be sent by SMS text message. It seems like it all worked okay, but there is not enough signal on the T-Mobil network there. Maybe a better modem with external antenna might work. Or maybe I can find an ATT prepaid SIM card that we can use. I put everything back to the way it was. The screen was having a hard time coming up. When it finally did it was reporting out of range and showing only a portion of the desktop. I collected all data, but the soilCO2 seemed short. Either the data logger wrapped its memory or the collection missed some. It’s probably not possible to recover it now. Siyan did the standard fieldwork and clipped some more of the litter inside the fence. On wire on the fence was broken and we fixed it. |
Field Data
No tank data
Well Depth
| Date | Location | Depth (feet) |
|---|---|---|
| 2014-01-07 | TZ_floor | 32 |
| 2014-01-07 | TZ_road | 39.8 |
| 2014-01-07 | TZ_tower | 37.8 |
mode = both
Moisture Point Probes TZ
Array
(
[0] => Tower_1
[1] => Floor_South_1
[2] => Floor_West_1
[3] => SoilCO2_1
[4] => Soil_Transect_4_1
[5] => Soil_Transect_3_1
[6] => Soil_Transect_2_1
[7] => Soil_Transect_1_1
[8] => SoilCO2_West_A_1
[9] => SoilCO2_West_B_1
[10] => SoilCO2_West_C_1
[11] => Tower_2
[12] => Floor_South_2
[13] => Floor_East_2
[14] => Floor_West_2
[15] => SoilCO2_2
[16] => Soil_Transect_4_2
[17] => Soil_Transect_3_2
[18] => Soil_Transect_2_2
[19] => Soil_Transect_1_2
[20] => SoilCO2_West_A_2
[21] => SoilCO2_West_B_2
[22] => SoilCO2_West_C_2
[23] => Tower_3
[24] => Floor_South_3
[25] => Floor_East_3
[26] => Floor_West_3
[27] => SoilCO2_3
[28] => Soil_Transect_4_3
[29] => Soil_Transect_3_3
[30] => Soil_Transect_2_3
[31] => Soil_Transect_1_3
[32] => SoilCO2_West_A_3
[33] => SoilCO2_West_B_3
[34] => SoilCO2_West_C_3
[35] => Floor_South_4
[36] => Floor_East_4
[37] => Floor_West_4
[38] => SoilCO2_4
[39] => Soil_Transect_4_4
[40] => Soil_Transect_3_4
[41] => Soil_Transect_2_4
[42] => Soil_Transect_1_4
[43] => SoilCO2_West_A_4
[44] => SoilCO2_West_B_4
[45] => SoilCO2_West_C_4
)
| Date | DOY | Rep | Depth | Tower_1 |
Floor_South_1 |
Floor_West_1 |
SoilCO2_1 |
Soil_Transect_4_1 |
Soil_Transect_3_1 |
Soil_Transect_2_1 |
Soil_Transect_1_1 |
SoilCO2_West_A_1 |
SoilCO2_West_B_1 |
SoilCO2_West_C_1 |
Tower_2 |
Floor_South_2 |
Floor_East_2 |
Floor_West_2 |
SoilCO2_2 |
Soil_Transect_4_2 |
Soil_Transect_3_2 |
Soil_Transect_2_2 |
Soil_Transect_1_2 |
SoilCO2_West_A_2 |
SoilCO2_West_B_2 |
SoilCO2_West_C_2 |
Tower_3 |
Floor_South_3 |
Floor_East_3 |
Floor_West_3 |
SoilCO2_3 |
Soil_Transect_4_3 |
Soil_Transect_3_3 |
Soil_Transect_2_3 |
Soil_Transect_1_3 |
SoilCO2_West_A_3 |
SoilCO2_West_B_3 |
SoilCO2_West_C_3 |
Floor_South_4 |
Floor_East_4 |
Floor_West_4 |
SoilCO2_4 |
Soil_Transect_4_4 |
Soil_Transect_3_4 |
Soil_Transect_2_4 |
Soil_Transect_1_4 |
SoilCO2_West_A_4 |
SoilCO2_West_B_4 |
SoilCO2_West_C_4 |
Avg | Spacial Count |
Measurement Count |
|---|---|---|---|---|---|---|---|---|---|---|---|---|---|---|---|---|---|---|---|---|---|---|---|---|---|---|---|---|---|---|---|---|---|---|---|---|---|---|---|---|---|---|---|---|---|---|---|---|---|---|---|---|
| 2014-01-07 | 7 | 0 | nan | 7.4 | 4.2 | 13 | 9.4 | 9.7 | 29.7 | 7.1 | 6.2 | 10 | 12.4 | 5 | 12.4 | 7.8 | 14.2 | 10.9 | 12.1 | 9.7 | 19.1 | -2.7 | 3.2 | 12.1 | 2.3 | 14.5 | 18.7 | 10.3 | 10.9 | 12 | 6.2 | 8.7 | 11.1 | 14.5 | 13.1 | 15.4 | 14.8 | 13.4 | 1.3 | 14.2 | 14.8 | 19.9 | 9 | 16.5 | 20.2 | 10.5 | 12.5 | 7.9 | 9.6 | |||
| 2014-01-07 | 7 | 1 | nan | 6 | 4.2 | 13.8 | 8.8 | 9.4 | 30.9 | 6.8 | 6.5 | 13 | 8.1 | 14.8 | 10.6 | 12.1 | 9.3 | 18.8 | 13.6 | 2.9 | 18.2 | 10.9 | 9.8 | 11.2 | 5.3 | 8.4 | 11.1 | 15.1 | 13.1 | 1.2 | 13.9 | 13 | 19.3 | 10.5 | 15.9 | 20.5 | 9.3 | |||||||||||||||
| 2014-01-07 | 7 | Avg | 0-15cm | 0 | 0 | |||||||||||||||||||||||||||||||||||||||||||||||
| 2014-01-07 | 7 | Avg | 15-30cm | 0 | 0 | |||||||||||||||||||||||||||||||||||||||||||||||
| 2014-01-07 | 7 | Avg | 30-45cm | 0 | 0 | |||||||||||||||||||||||||||||||||||||||||||||||
| 2014-01-07 | 7 | Avg | 45-60cm | 0 | 0 |
mode = both
Moisture Point Probes VR
Array
(
[0] => Solar_Panels_1
[1] => Flux_Tower_1
[2] => Gate_1
[3] => Biomass_Cage_1
[4] => Solar_Panels_2
[5] => Flux_Tower_2
[6] => Gate_2
[7] => Biomass_Cage_2
[8] => Solar_Panels_3
[9] => Flux_Tower_3
[10] => Gate_3
[11] => Biomass_Cage_3
[12] => Solar_Panels_4
[13] => Flux_Tower_4
[14] => Gate_4
[15] => Biomass_Cage_4
)
| Date | DOY | Rep | Depth | Solar_Panels_1 |
Flux_Tower_1 |
Gate_1 |
Biomass_Cage_1 |
Solar_Panels_2 |
Flux_Tower_2 |
Gate_2 |
Biomass_Cage_2 |
Solar_Panels_3 |
Flux_Tower_3 |
Gate_3 |
Biomass_Cage_3 |
Solar_Panels_4 |
Flux_Tower_4 |
Gate_4 |
Biomass_Cage_4 |
Avg | Spacial Count |
Measurement Count |
|---|---|---|---|---|---|---|---|---|---|---|---|---|---|---|---|---|---|---|---|---|---|---|
| 2014-01-07 | 7 | 0 | nan | 5.3 | 9.7 | 5.6 | 2.7 | 15.2 | 10 | 10.6 | 8.1 | 13.1 | 2.8 | 10.6 | 13.4 | 22.8 | 9.6 | 5 | 11.3 | |||
| 2014-01-07 | 7 | 1 | nan | 4.7 | 8.6 | 4.5 | 2.4 | 13.6 | 10.3 | 11.2 | 8.4 | 12.8 | 2.3 | 11.2 | 13.4 | 22.8 | 10.2 | 5.3 | 11.6 | |||
| 2014-01-07 | 7 | Avg | 0-15cm | 0 | 0 | |||||||||||||||||
| 2014-01-07 | 7 | Avg | 15-30cm | 0 | 0 | |||||||||||||||||
| 2014-01-07 | 7 | Avg | 30-45cm | 0 | 0 | |||||||||||||||||
| 2014-01-07 | 7 | Avg | 45-60cm | 0 | 0 |
No TZ grass heigth found
No VR grass heigth found
No VR Tree DBH found
No water potential data found
No VR Grass Biomass data found
No VR OakLeaves Biomass data found
No VR PineNeedles Biomass data found
2 photos found

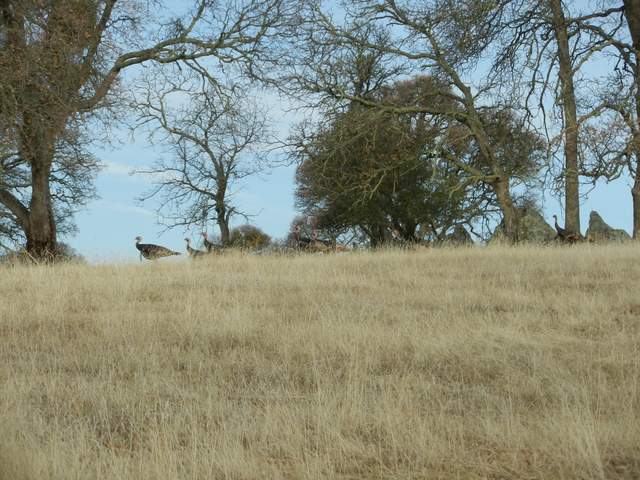
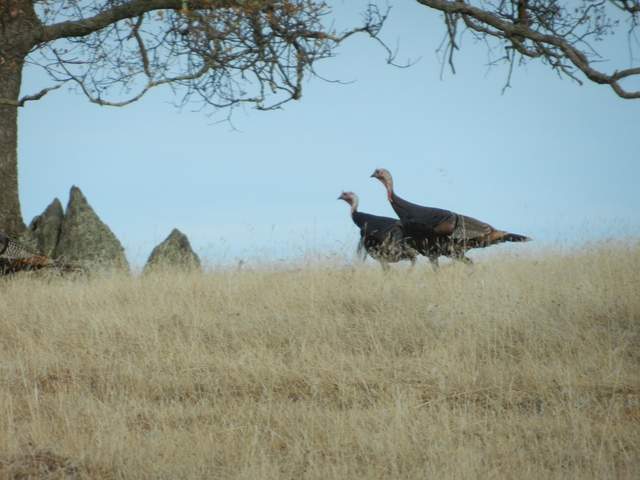
20140107VR_Turkeys2.jpg ( 2014-01-07 09:59:48 ) Full size: 1920x1440
Turkeys on the rise

20140107VR_Turkeys1.jpg ( 2014-01-07 09:59:37 ) Full size: 1920x1440
Turkeys on the rise
9 sets found
16 VR_met graphs found
2 VR_flux graphs found
6 VR_soilco2 graphs found
No data found for VR_pond.
Can't check TZVR_mixed
No data found for VR_fd.
4 VR_processed graphs found
No data found for VR_arable.
No data found for VR_soilvue.

