
Field Notes
<--2013-07-28 10:30:00 | 2013-08-13 10:15:00-->Other sites visited today: Vaira | Tonzi
Phenocam link: Searching...
Tonzi: 2013-08-13 09:15:00 (DOY 225)
Author: Siyan Ma
Others: Joe
Summary: Standard field work, swapped Vaira 7500, fixed minor problems with VR HMP45 solar shield and LI820, midday water potential
|
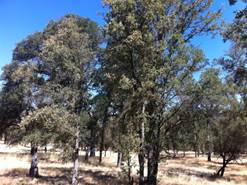
When: Date: 8/13/2013 , Day: 225 , Watch Time: 9:15 am . Where: Tonzi/Vaira Ranch Who: Siyan Weather: clear, hot and dry, nice breeze Phenology: yellow grasses; green oak trees; more yellow oak leaves at Tonzi than at Vaira; no cows at both sites
Summary
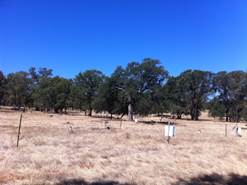
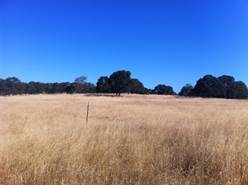
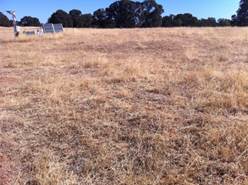
Vaira_Grass Site
   Tower Site
Toniz_Floor Site
|
Field Data
No tank data
Well Depth
| Date | Location | Depth (feet) |
|---|---|---|
| 2013-08-13 | TZ_floor | 30.2 |
| 2013-08-13 | TZ_road | 38.4 |
| 2013-08-13 | TZ_tower | 35.8 |
No TZ Moisture Point data found
No VR Moisture Point data found
No TZ grass heigth found
No VR grass heigth found
Tree DBH
| Date | Tag# | Reading (mm) |
|---|---|---|
| 2013-08-13 | 1 | 25.1 |
| 2013-08-13 | 2 | 17.5 |
| 2013-08-13 | 245 | 13.1 |
| 2013-08-13 | 3 | 20.5 |
| 2013-08-13 | 4 | 3.6 |
| 2013-08-13 | 5 | 24.5 |
| 2013-08-13 | 7 | 17 |
| 2013-08-13 | 72 | 15 |
| 2013-08-13 | 79 | 17.2 |
| 2013-08-13 | 8 | 8.5 |
Water Potential - mode: raw
| Time | Species | Tree | readings (bar) | ||
|---|---|---|---|---|---|
| 2013-08-13 12:00:00 | OAK | 102 | -33.5 | -25 | |
| 2013-08-13 12:00:00 | OAK | 35 | -31.5 | -30 | -12 |
| 2013-08-13 12:00:00 | OAK | 92 | -30 | -20 | -26.5 |
| 2013-08-13 12:00:00 | PINE | OLD | -21 | -20 | -7 |
| 2013-08-13 12:00:00 | PINE | YNG | -21.5 | -16 | -6 |
No TZ Grass Biomass data found
No TZ OakLeaves Biomass data found
No TZ PineNeedles Biomass data found
0 photos found
16 sets found
No data found for TZ_Fenergy.
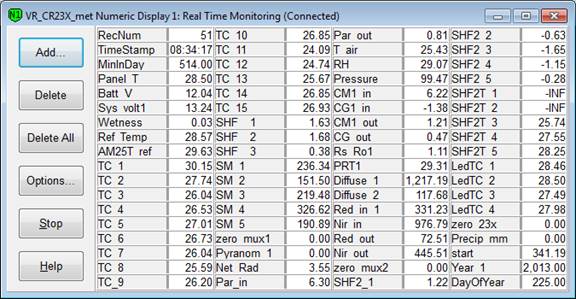
11 TZ_tmet graphs found
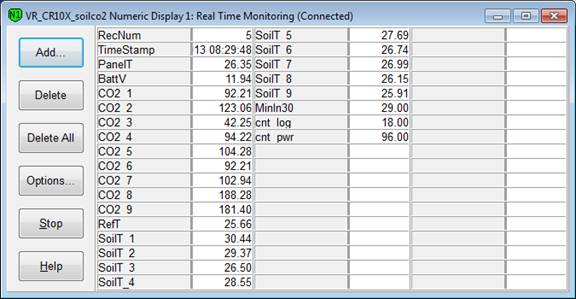
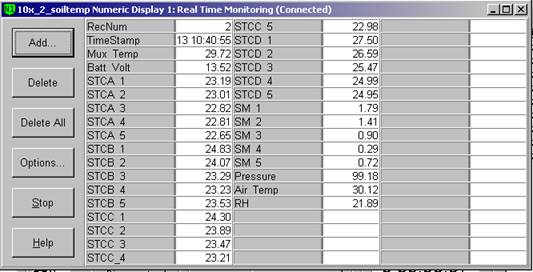
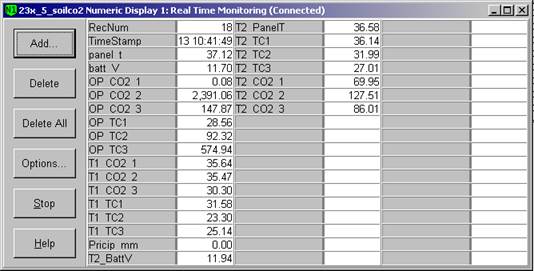
11 TZ_soilco2 graphs found
Can't check TZ_mixed
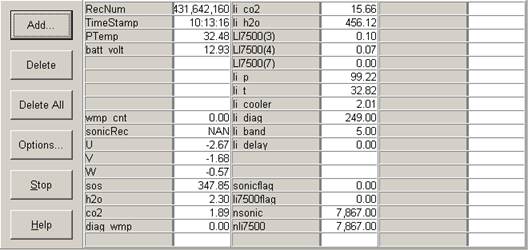
3 TZ_mixed graphs found
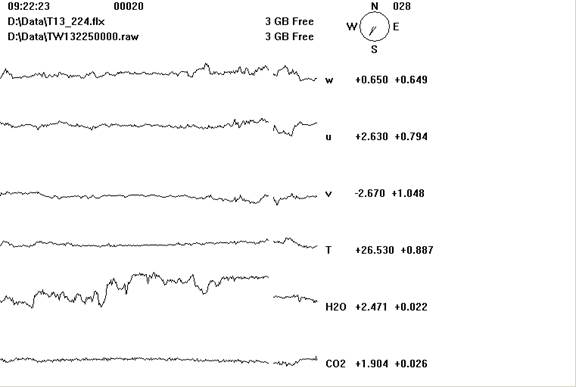
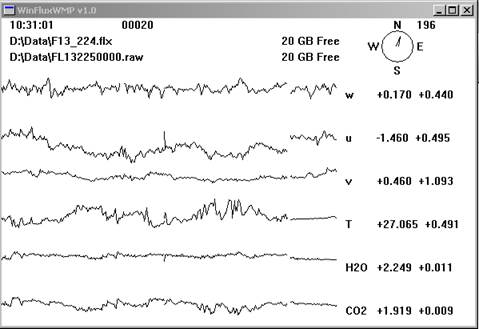
1 TZ_fflux graphs found
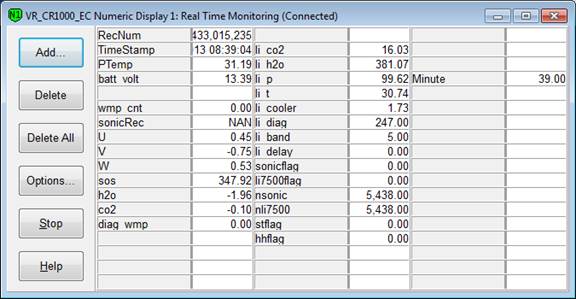
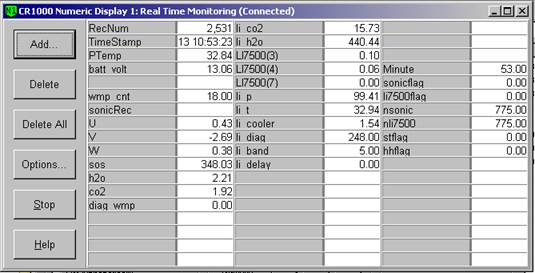
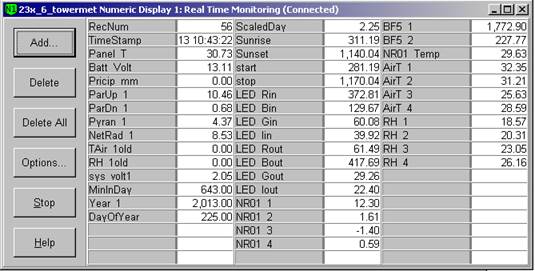
8 TZ_fmet graphs found
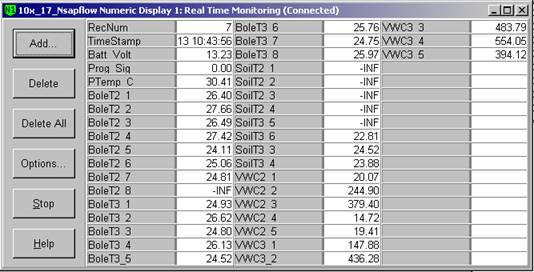
1 TZ_tram graphs found
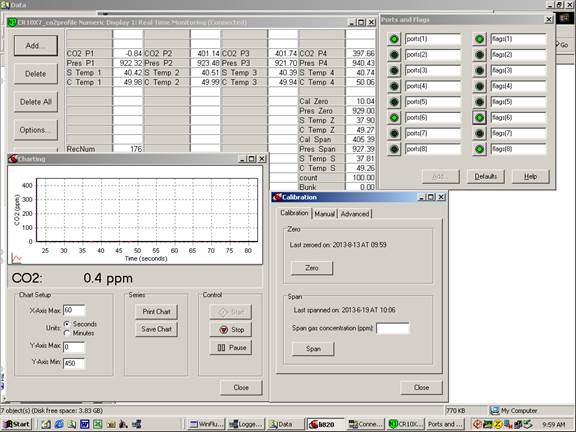
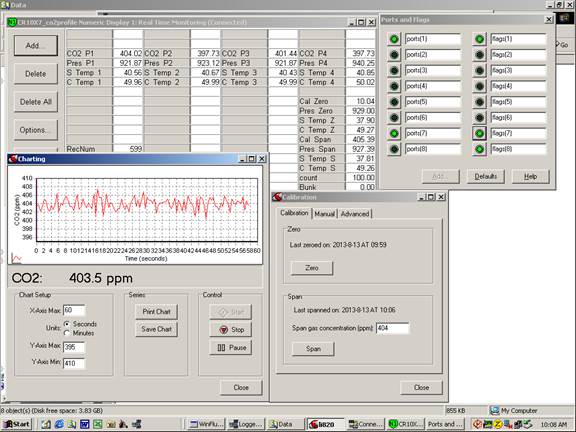
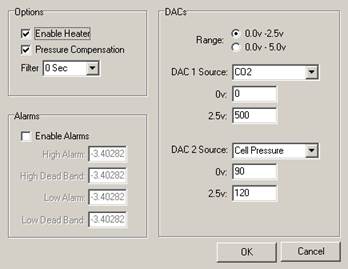
3 TZ_co2prof graphs found
No data found for TZ_irt.
No data found for TZ_windprof.
1 TZ_tflux graphs found
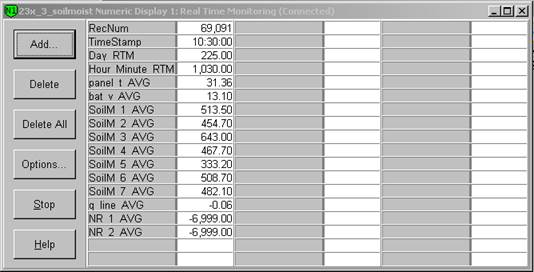
2 TZ_sm graphs found
Can't check TZ_met
1 TZ_met graphs found
Can't check TZVR_mixed
8 TZ_osu graphs found
No data found for TZ_fd.
Tonzi Z-cam data