
Field Notes
<--2013-06-19 13:15:00 | 2013-08-13 09:15:00-->Other sites visited today: Tonzi | Tonzi
Phenocam link: Searching...
Vaira: 2013-07-11 09:30:00 (DOY 192)
Author: Joe Verfaillie
Others: Siyan
Summary: Standard fieldwork, collected data, remounted Raspberry Pi
| Vaira 2013-07-11 I arrived about 9:30 with Siyan. It was clear and mild with a breeze from the south west. Things look very dry. The water hole still has a little water in the bottom. The trees still look okay for the most part but there are several that look brown and more brown leaves on the others. I collected the data while Siyan did the fieldwork. I remounted the Raspberry Pi. Actually I swapped the Raspberry Pi with a new one that was mounted in some Plexiglas shields. I put the SD card in the new Pi and it booted just like the old one. The new one is mounted in the side of the box under the fan. The cable runs are much neater and more protected. The HMP45 fan seems dead. I need to post the connection info for the Phenocam: 192.168.2.101 admin/admin |
Field Data
No tank data
Well Depth
| Date | Location | Depth (feet) |
|---|---|---|
| 2013-07-11 | TZ_floor | 29 |
| 2013-07-11 | TZ_road | 38.5 |
| 2013-07-11 | TZ_tower | 33.7 |
No TZ Moisture Point data found
No VR Moisture Point data found
No TZ grass heigth found
No VR grass heigth found
No VR Tree DBH found
No water potential data found
No VR Grass Biomass data found
No VR OakLeaves Biomass data found
No VR PineNeedles Biomass data found
2 photos found
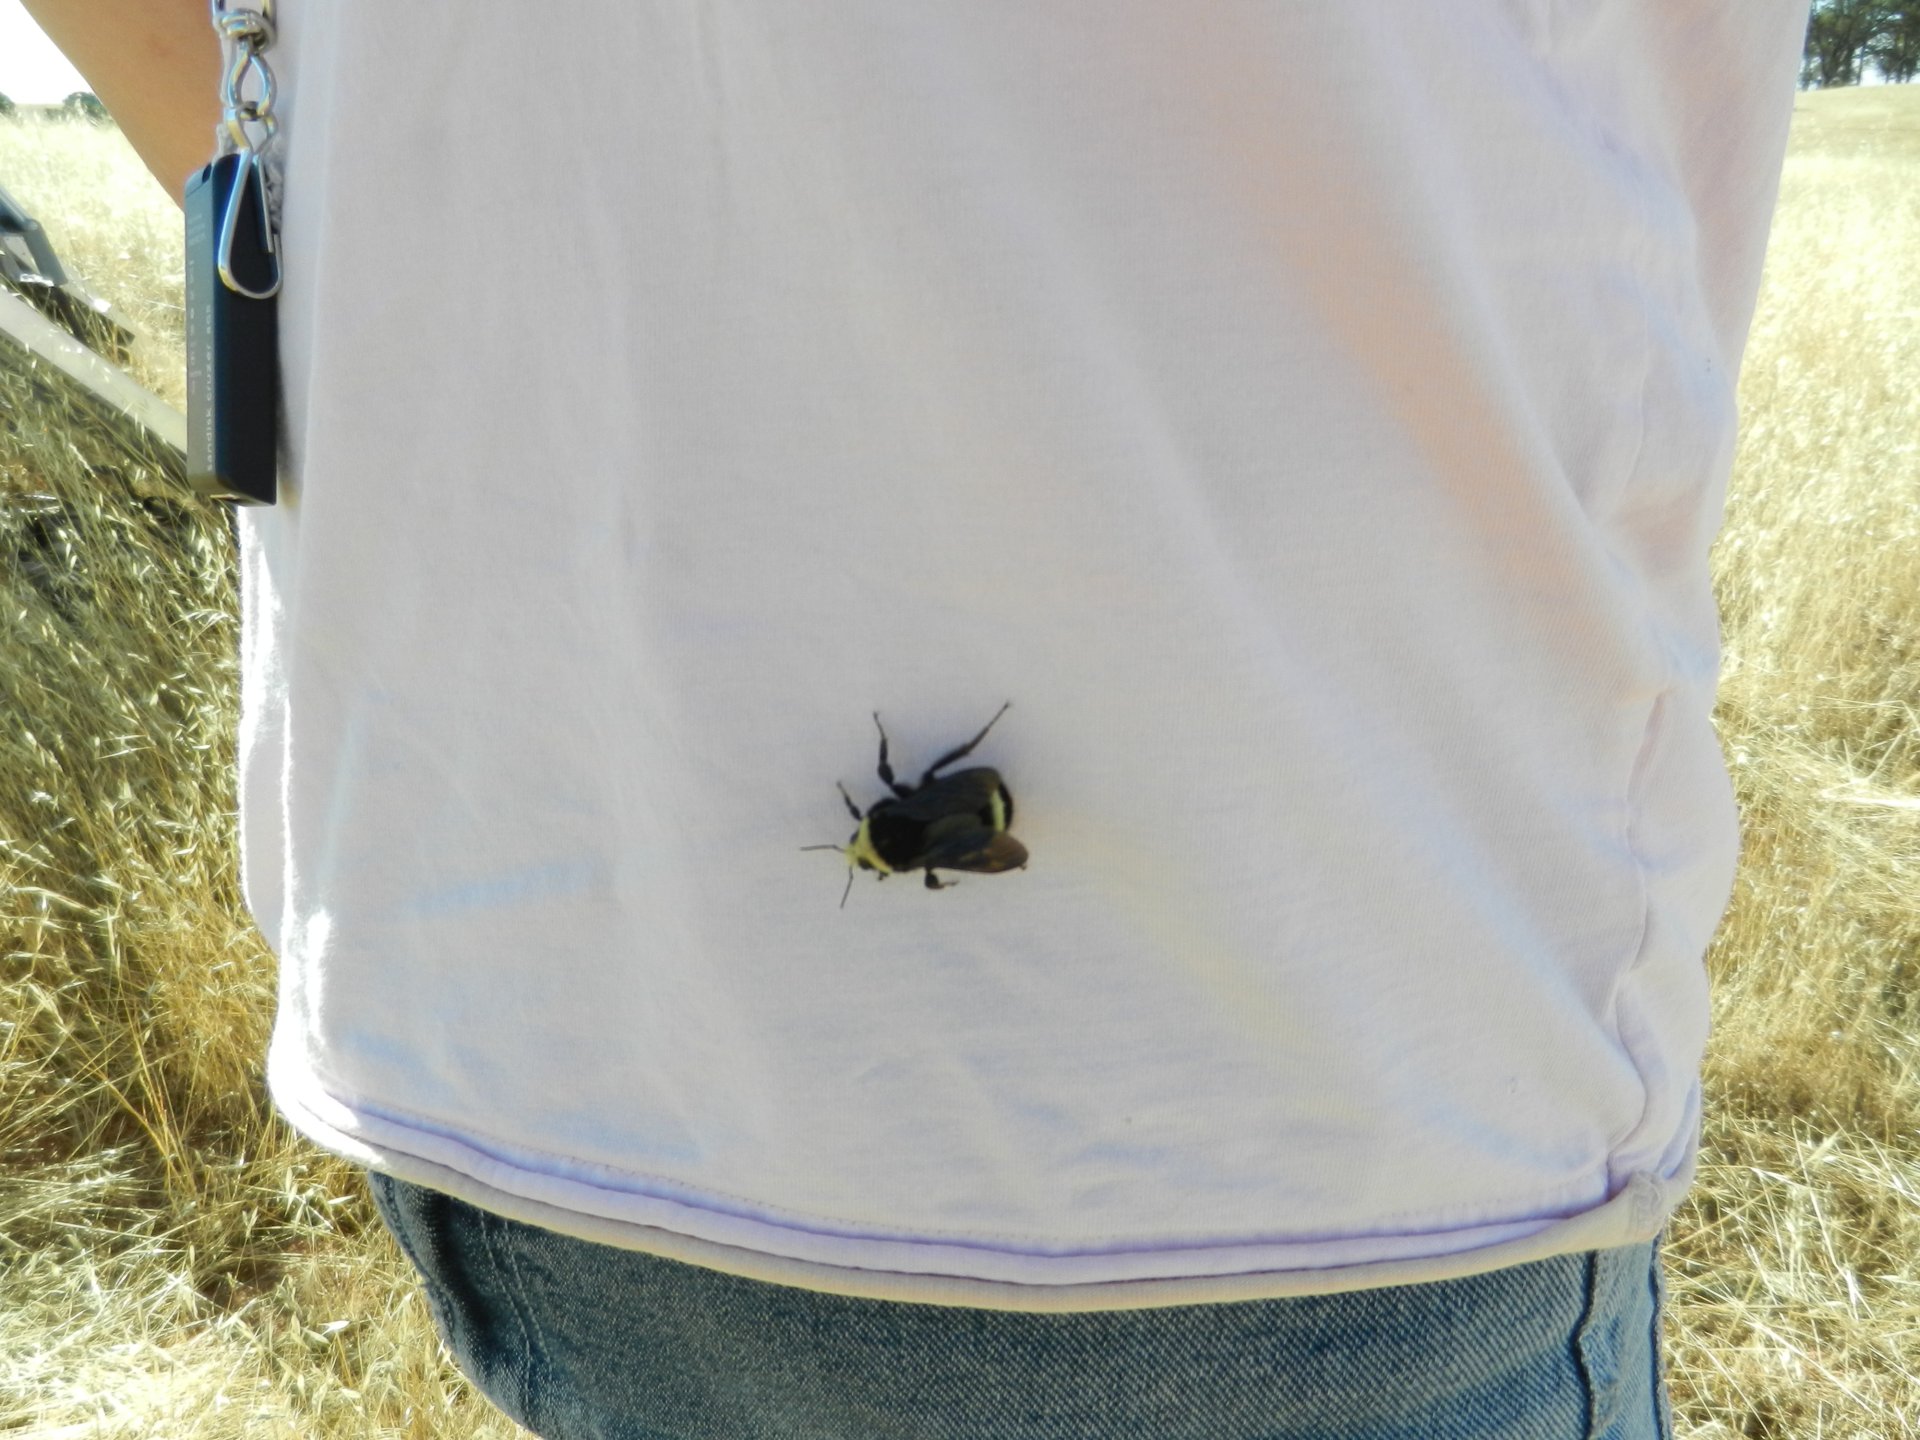
20130711VR_SiyanBumbleBee.jpg ( 2013-07-11 09:11:52 ) Full size: 1920x1440
Bumble bee on Siyan
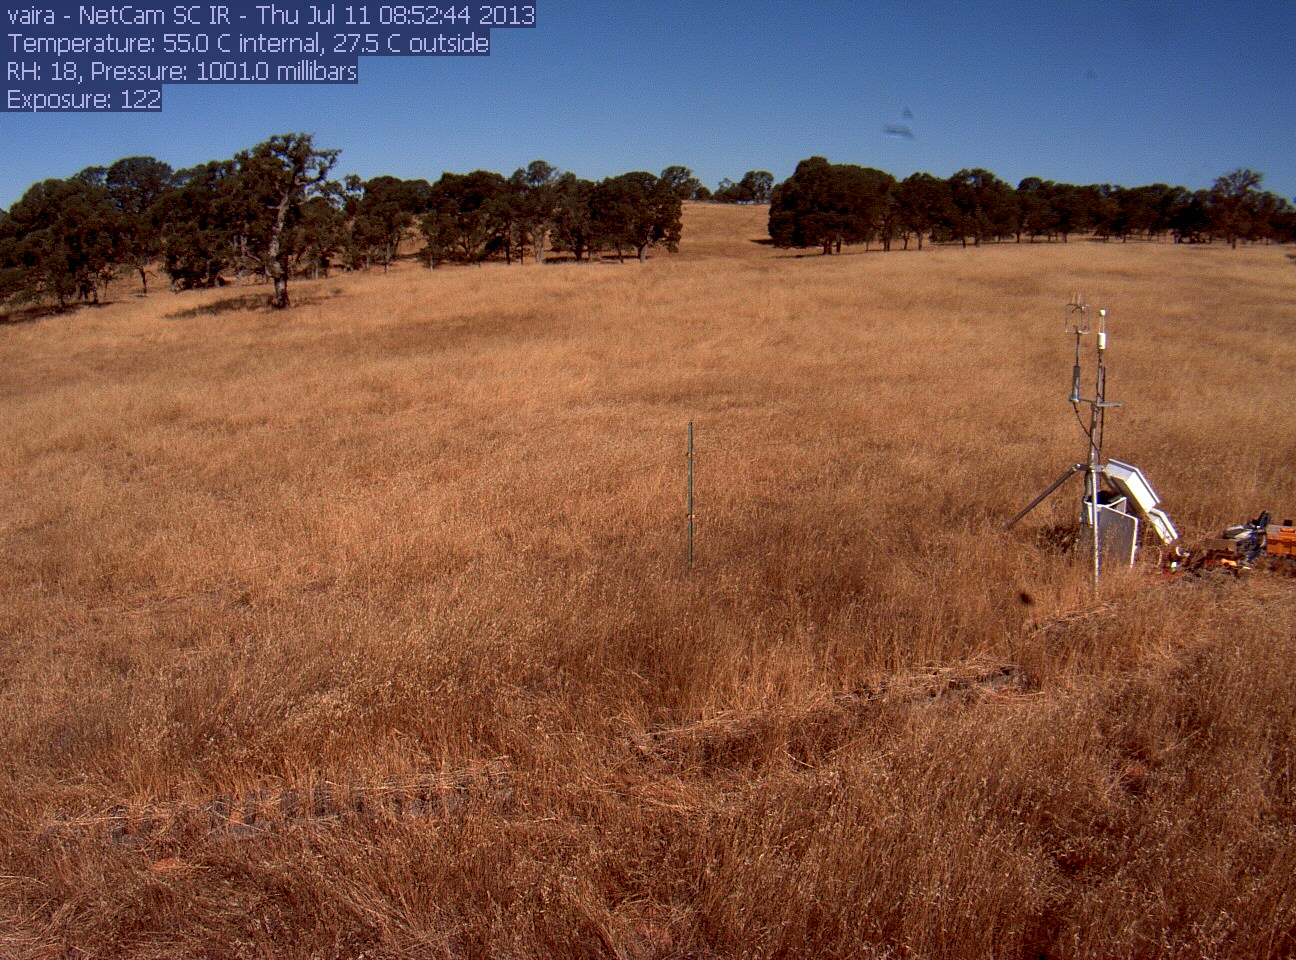
vaira_2013_07_11_085244.jpg ( 2013-07-11 16:50:22 ) Full size: 1296x960
Fieldwork
9 sets found
16 VR_met graphs found
2 VR_flux graphs found
6 VR_soilco2 graphs found
No data found for VR_pond.
Can't check TZVR_mixed
No data found for VR_fd.
4 VR_processed graphs found
No data found for VR_arable.
No data found for VR_soilvue.