Field Notes
<--2013-05-09 15:30:00 | 2013-05-24 16:00:00-->Other sites visited today: Twitchell Rice | Vaira | Tonzi
Phenocam link: Searching...
Sherman Island: 2013-05-15 15:00:00 (DOY 135)
Author: Joe Verfaillie
Others:
Summary: Quick check on mercury trailer removal - all is well
| Sherman 2013-05-15 On the way home from Tonzi, Frank called me to say that the mercury trailer had been removed from Sherman. I stopped by to check on things. It was sunny, warm and windy. The pepper weed is in heavy bloom I could smell the pollen in the air. It looks like the trailer was removed cleanly. The cow fencing was in working order. The power lines the trailer used were tied up on the old solar panel post and the breakers were turned off. Our systems seemed to be running just fine. It looks like they were able to pull the trailer through the gate in the southeast corner of the field. |
2 photos found

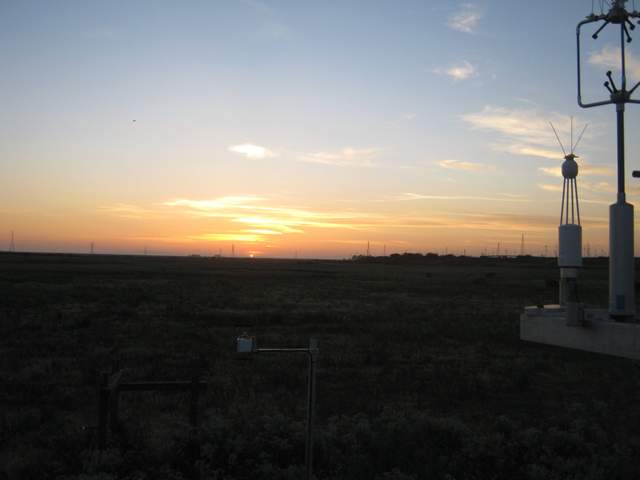
SI_autocam_20130514_1915.jpg ( 2013-05-14 19:15:02 ) Full size: 1920x1440
Nice sunset

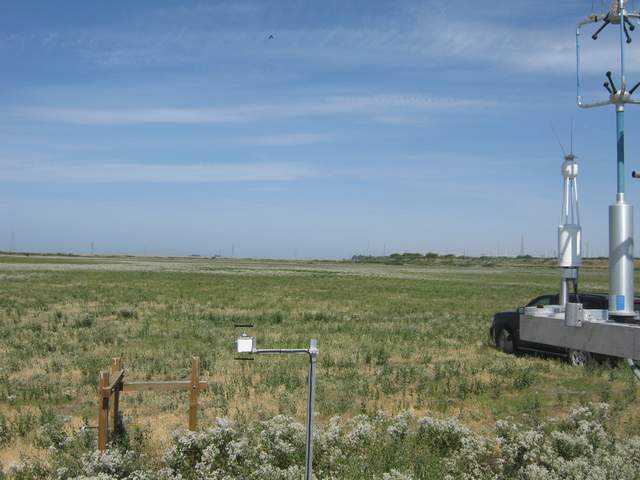
SI_autocam_20130515_0945.jpg ( 2013-05-15 09:45:03 ) Full size: 1920x1440
EPA mercury trailer pulling out
7 sets found
No data found for SI_mp.
11 SI_met graphs found
Can't check SI_mixed
2 SI_mixed graphs found
4 SI_flx graphs found
3 SI_soilco2 graphs found
Can't check TWSI_mixed
Can't check SIMBTWEE_met

