Field Notes
<--2013-04-11 09:00:00 | 2013-04-26 09:30:00-->Other sites visited today: Tonzi
Phenocam link: Searching...
Sherman Island: 2013-04-19 17:30:00 (DOY 109)
Author: Joe Verfaillie
Others:
Summary: Met Bryan, collected data for Ameriflux, put covers back on power pole boxes.
| Sherman
2013-04-19 I arrived at about 5:30pm on the way home from Tonzi. It was warm, clear and sunny. Lots of frogs were making noise from a flooded field to the east. I met Bryan Brock on the way in. He said that the construction of the new wetland on Twitchell will begin in about three weeks (around May 13 by my calendar). He said that there was likely a place downwind of the construction where we could keep the corn tower running. We made tentative plans to meet next Friday at Twitchell to look for that tower location and for a alfalfa tower location. I collected CR1000, met and soil CO2 data from the Sherman tower for the Ameriflux folks. They had pulled out there towers on Thursday. I also put the covers back on the power boxes on the power pole that I left off last time. |
1 photos found

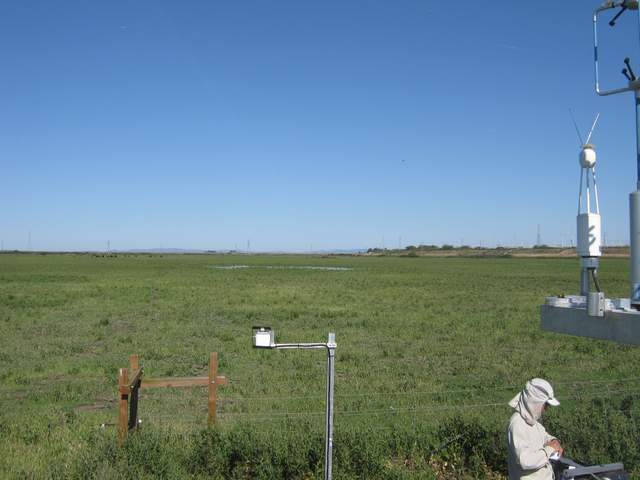
SI_autocam_20130418_0845.jpg ( 2013-04-18 08:45:02 ) Full size: 1920x1440
Ameriflux take down
7 sets found
No data found for SI_mp.
11 SI_met graphs found
Can't check SI_mixed
2 SI_mixed graphs found
4 SI_flx graphs found
3 SI_soilco2 graphs found
Can't check TWSI_mixed
Can't check SIMBTWEE_met

