Field Notes
<--2008-03-06 00:00:00 |
2008-03-20 00:00:00-->
Other sites visited today:
Tonzi
Phenocam link:
Searching...Tonzi: 2008-03-06 10:30:00 (DOY 66)
Author: Dennis Baldocchi
Others: Siyan Ma
When: Date: 3/6/3008 ,
Day: 66 ,
Watch Time: 10:30 .
Where: Tonzi/Vaira Ranch
Who: DDB and Siyan
Weather:
clear with light, white cloud in the morning; cloudy in the afternoon, and
Youngryle was able to take tree LAI measurements.
Phenology:
grasses grew stronger. Some are
tillerring (2-3).
Summary
- CO2 profile: flow rate of
CO2 tank need to be double checked since the tank pressure seems running
down fast.
- DDB installed soil CO2
probes!!! Floor computer successfully connected to the datalogger.
- Checked and download data at
Tower, Floor, and Vaira. The three
EC systems worked well.
- Collected grass sample for
LAI and phenology in Tower and Vaira, oak branches for N
- Read dendrometers.
- spectrometer (Youngryle)
Vaira_Grass
Site
- Fence and gate power: >12 v.
- Panel and Batteries: 13.9 v; 14.1 amps; 2.7 amps.
- Reading from Gillsonic screen
before downloading data. (The value
of H2O and CO2 should be in the range of 0 – 5 v.)
Time
|
|
Path/File name
|
D:\Data\V08_ 66
.flx
D:\Data\VR08 .raw
|
|
mean
|
std
|
|
mean
|
std
|
w
|
0.29
|
0.425
|
Ts
|
17.508
|
0.484
|
u
|
2.88
|
1.171
|
H2O
|
2.05
|
0.07
|
v
|
-1.91
|
0.974
|
CO2
|
1.98
|
0.022
|
|
|
|
Tc
|
1.421
|
0.051
|
- downloading data Yes!
- swaping Li-7500
Analyzer. (Remove SN# 42
; install SN# 976 )
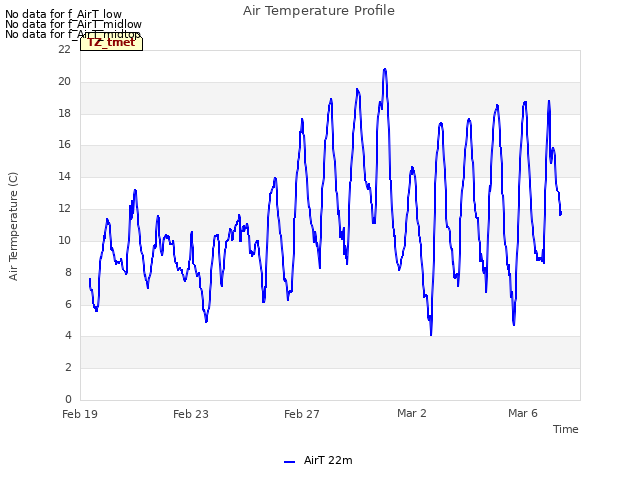
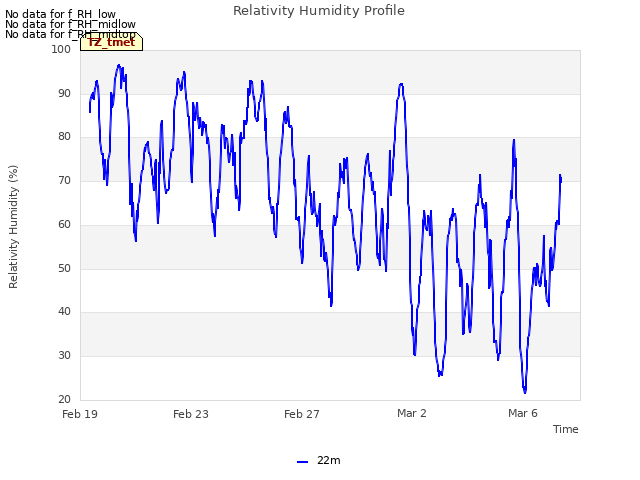
- check the fans of air temp.
and relative humidity sensors at Vaira.
- Check MD-9 system connections.
Yes!
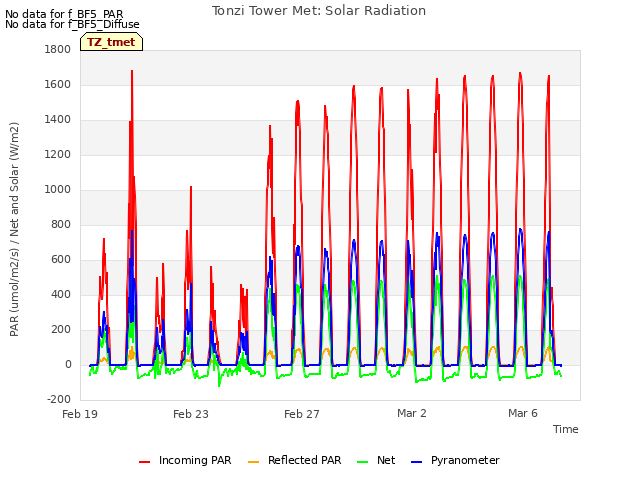
- Check levels of Radiation
sensors, clear up surfaces. Yes!
9. Closed gate and
set up fence. Yes!
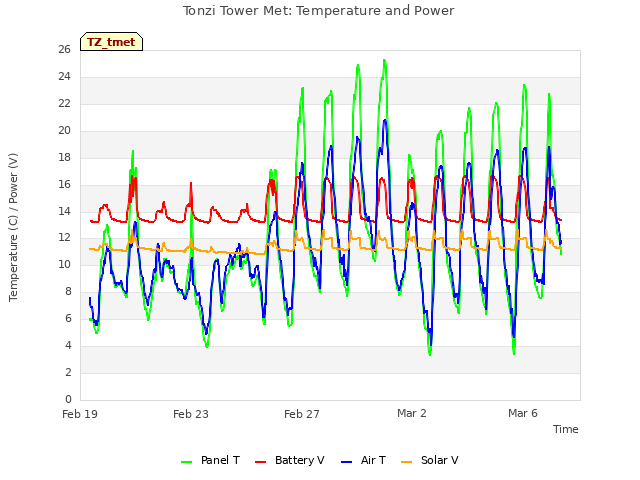
Tonzi_Tower Site
- Fence and gate power: >12 v.
- Panel and Batteries: 13.3 v; 0.0 amps; 5.0 amps.
- Reading from Gillsonic screen
before downloading data. (The value
of H2O and CO2 should be in the range of 0 – 5 v.)
Time
|
|
Path/File name
|
D:\Data\T08_ 66
.flx
D:\Data\TW08 .raw
|
|
mean
|
std
|
|
mean
|
std
|
w
|
0.03
|
0.55
|
Ts
|
8.9
|
0.279
|
u
|
-2.13
|
0.79
|
H2O
|
1.66
|
0.026
|
v
|
1.36
|
0.66
|
CO2
|
2.009
|
0.07
|
- downloading data
- swaping Li-7500
Analyzer. (Remove SN# 418 ; install SN# 35 )
- check the fans of air temp.
and relative humidity sensors on the tower and the floor.
- Check calibration cylinders;
CO 2 1000 psig; flow 20
psi. (431.8 ppm)
N 2 2000
psig; flow 20 psi.
Manually calibrate Li-800. Following Ted’s instruction: H:\IoneSavanna_2004\Tower_2004\CO2Profile\LI800_Calibration_Procedure_2Nov04.txt
Is the pump running Yes!
1
|
2
|
3
|
4
|
zero
|
span
|
437
|
437
|
439.8
|
437.1
|
1.47
|
488.95
|
939
|
939
|
939
|
939.9
|
939.7
|
939.86
|
45.7
|
45.6
|
45.5
|
45.6
|
44.5
|
44.3
|
49.9
|
49.9
|
49.9
|
49.9
|
49.1
|
49.1
|
- close gate and set up fence. Yes!
Toniz_Floor
Site
- Fence and gate power: >12 v.
- Panel and Batteries: 13.6 v; 11.2 amps; 1.8 amps.
- Reading from Gillsonic screen
before downloading data. (The value
of H2O and CO2 should be in the range of 0 – 5 v.)
Time
|
|
Path/File name
|
D:\Data\F08_
66 .flx
D:\Data\FL08 .raw
|
|
mean
|
std
|
|
mean
|
std
|
w
|
0.23
|
0.236
|
Ts
|
18.630
|
1.144
|
u
|
-1.8
|
0.313
|
H2O
|
2.319
|
0.211
|
v
|
0.17
|
0.246
|
CO2
|
1.873
|
0.035
|
- downloading data
- swaping Li-7500
Analyzer. (Remove SN# 41 ; install SN# 65 )
- Check MD-9 system connections
CR23X3 – floor-Met Yes!
CR23X5 – soil CO 2
profile Yes!
CR23X6 – tower-Met Yes!
CR10X2 – floor-Met Yes!
CR10X4 – sap-flow Yes!
CR10X7 – CO 2 profile (to Tower PC)
CR10X8 – wind profile Yes!
- Soil CO2 profile; DDB
installed soil CO2 probes!!! Floor computer successfully connected to the
datalogger.
- Close gate and set up fence. Yes!
tonzi
|
7931AFE
|
402165
|
574B4B
|
402FF3
|
574632
|
7A432E
|
7A3C6E
|
7A3B40
|
7A4AAA
|
6-Mar-08
|
66
|
|
|
|
|
|
|
|
|
|
SM
|
|
|
|
|
|
|
|
|
0-15
|
37.5
|
34.9
|
18.4
|
40.4
|
39.2
|
20.1
|
40.2
|
47.3
|
35.0
|
15-30
|
31.9
|
34.2
|
31.9
|
40.0
|
23.7
|
24.9
|
43.7
|
30.9
|
35.1
|
30-45
|
38.2
|
23.0
|
28.7
|
40.9
|
28.5
|
27.7
|
43.7
|
30.0
|
36.7
|
45-60
|
26.6
|
23.9
|
20.4
|
39.2
|
31.2
|
33.8
|
39.8
|
34.0
|
37.3
|
|
|
|
|
|
|
|
|
|
|
|
A6D882B
|
A3D04E8
|
A6D72F5
|
|
|
|
|
|
|
|
|
|
|
|
|
|
|
|
|
0-15
|
42.2
|
42.1
|
27.2
|
|
|
|
|
|
|
15-30
|
53.9
|
34.8
|
43.6
|
|
|
|
|
|
|
30-45
|
57.8
|
41.1
|
49.9
|
|
|
|
|
|
|
45-60
|
46.0
|
46.6
|
49.3
|
|
|
|
|
|
|
|
|
|
|
|
|
|
|
|
|
vaira
|
57318a
|
7933dee
|
|
|
|
|
|
|
|
0-15
|
21.9
|
18.6
|
|
|
|
|
|
|
|
15-30
|
25.2
|
30.8
|
|
|
|
|
|
|
|
30-45
|
29.2
|
29.7
|
|
|
|
|
|
|
|
45-60
|
32.1
|
36.8
|
|
|
|
|
|
|
|
Tonzi
|
|
|
|
Dendrometer
|
|
|
|
|
|
|
Date
|
Day
|
Tag #
|
Reading (cm)
|
3/6/2008
|
66
|
71
|
X
|
|
|
72
|
7.1
|
|
|
77
|
X
|
|
|
78
|
X
|
|
|
79
|
11.5
|
|
|
245
|
3.1
|
|
|
248
|
12.1
|
|
|
250
|
8.2
|
|
|
255
|
X
|
|
|
252
|
X
|
|
|
102
|
4.7
|
Notes:
“X” means not working any more.
|
Field Data
No tank data
No TZ Well data found
No TZ Moisture Point data found
No VR Moisture Point data found
No TZ grass heigth found
No VR grass heigth found
No TZ Tree DBH found
No water potential data found
No TZ Grass Biomass data found
No TZ OakLeaves Biomass data found
No TZ PineNeedles Biomass data found
0 photos found
16 sets found
No data found for TZ_Fenergy.
11 TZ_tmet graphs found


No data found for TZ_soilco2.
Can't check TZ_mixed
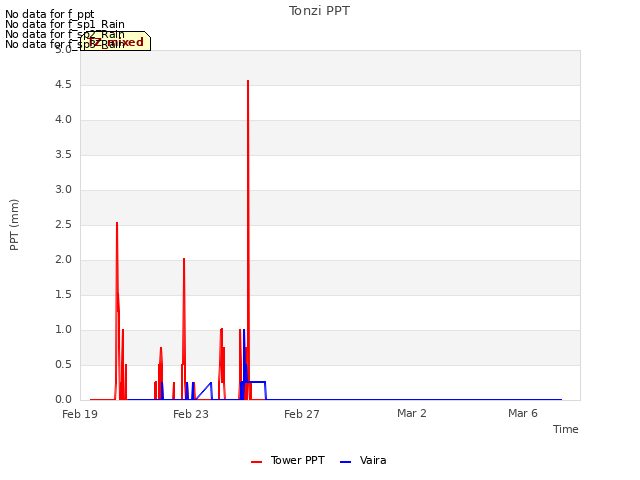
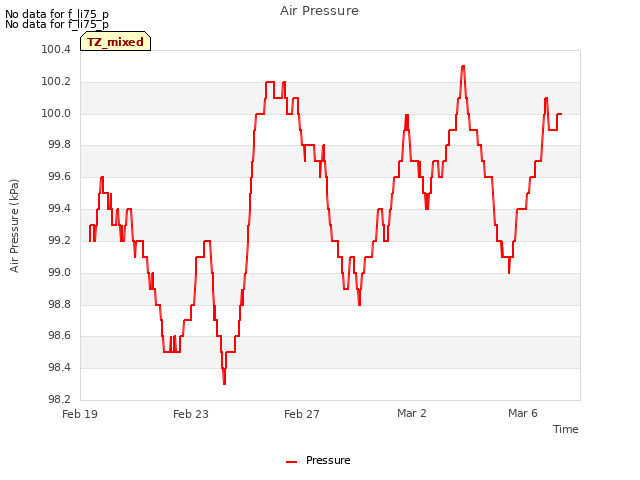
3 TZ_mixed graphs found

No data found for TZ_fflux.
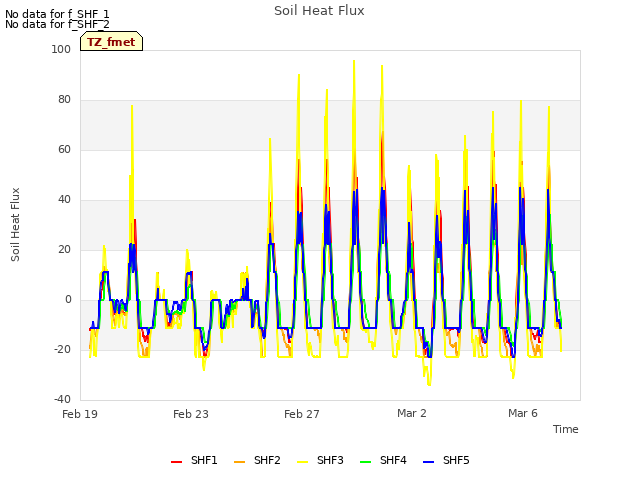
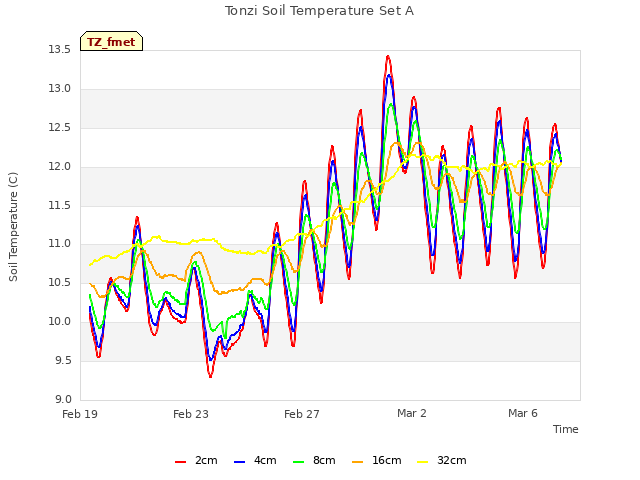
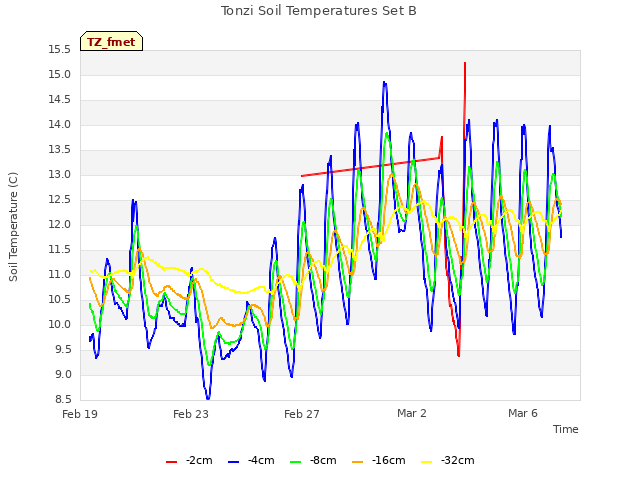
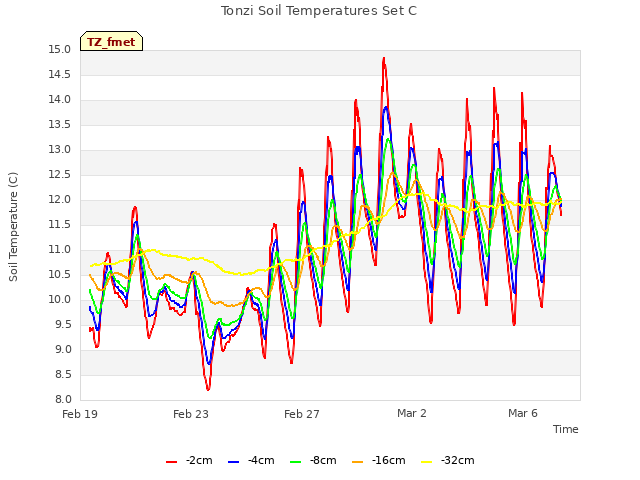
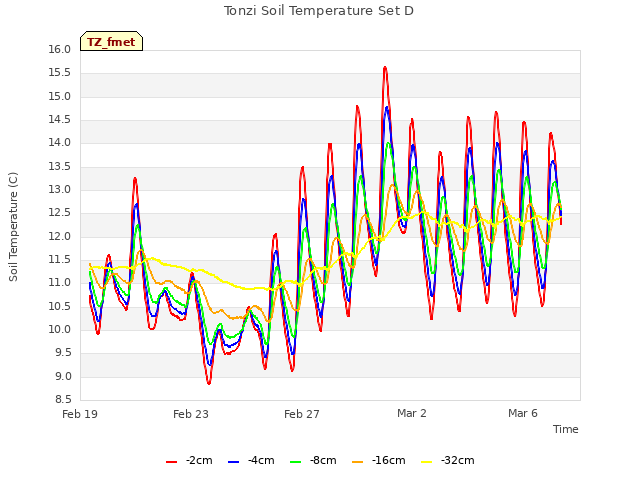
8 TZ_fmet graphs found


No data found for TZ_tram.
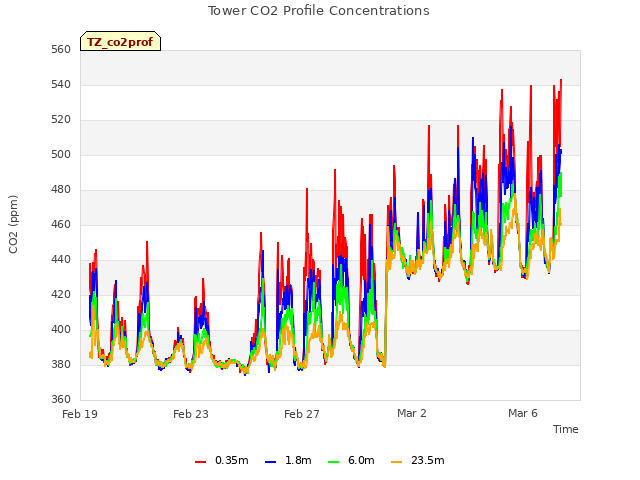
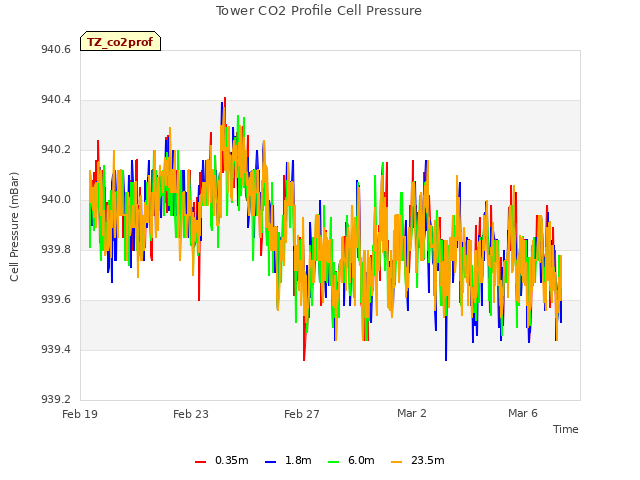
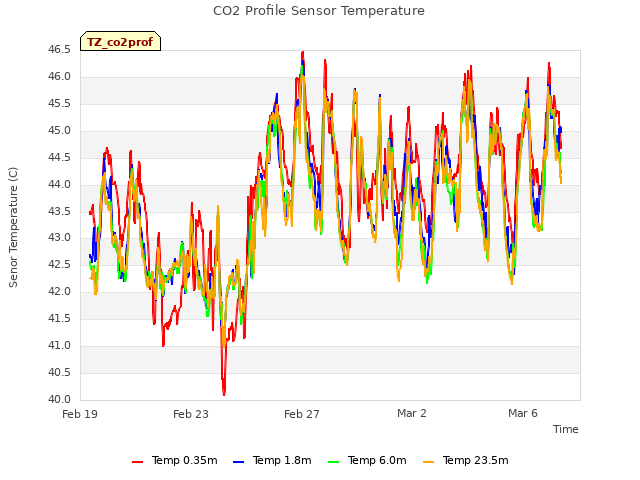
3 TZ_co2prof graphs found
No data found for TZ_irt.
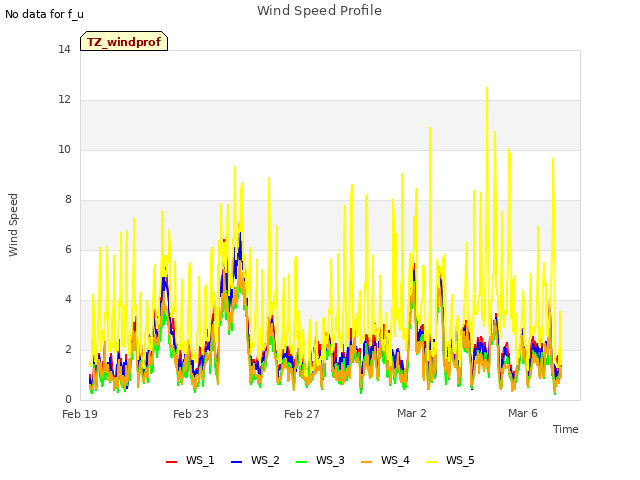
1 TZ_windprof graphs found
No data found for TZ_tflux.
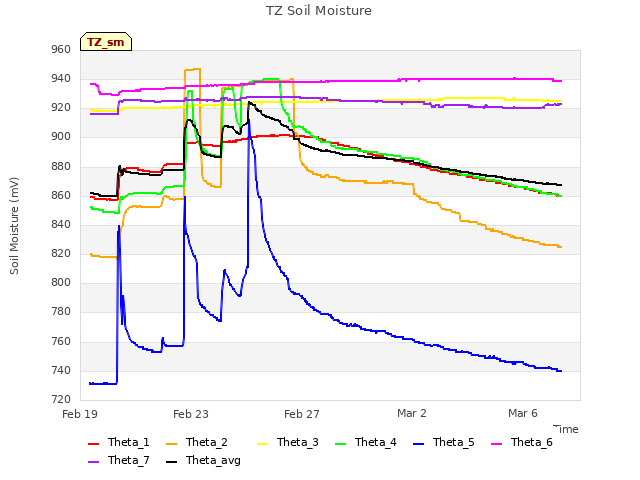
2 TZ_sm graphs found

Can't check TZ_met
1 TZ_met graphs found
Can't check TZVR_mixed
No data found for TZ_osu.
No data found for TZ_fd.
Tonzi Z-cam data


