Field Notes
<--2012-12-14 14:00:00 | 2013-01-17 14:40:00-->Other sites visited today: Sherman Island | Mayberry | Twitchell Rice | West Pond
Phenocam link: Searching...
DWR Corn: 2013-01-03 08:15:00 (DOY 3)
Author: Cove Sturtevant
Others: Joe
Summary: Frosty! Downloaded data. Installed water pressure sensor. Tower is good.
| DWR Corn
2013-01-03 We arrived around 08:15 PST. It was cold and foggy, air temperature hovering right at freezing. There was a thick layer of frost on the ground and puddle surfaces were frozen. The field was very wet, with standing water in patches. We downloaded the data and autocam pics, and cleaned the flux and radiation instruments. There was a thick layer of (frozen) spider webs and some ice on the flux instruments. Batteries at the tower were good, about 15 V. We also installed a new water pressure sensor out in the field. At the time of install, the reading was 0.90, the water level was 20 cm below the surface, and the top of the pvc tube was 20 cm above the surface. Tower readings: CO2: 23 mmol m-3 H2O: 280 mmol m-3 diag: 255 cleaned to 247 t=0 °C |
5 photos found
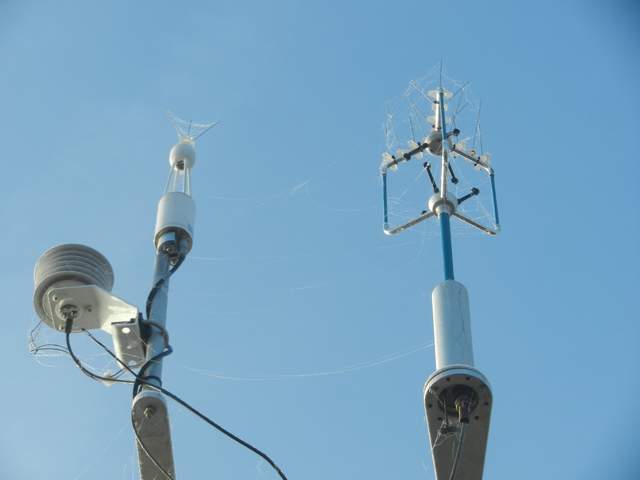
20130103DC_EddySpiderWebs.jpg ( 2013-01-03 09:43:28 ) Full size: 1920x1440
Spider webs on the eddy sensors
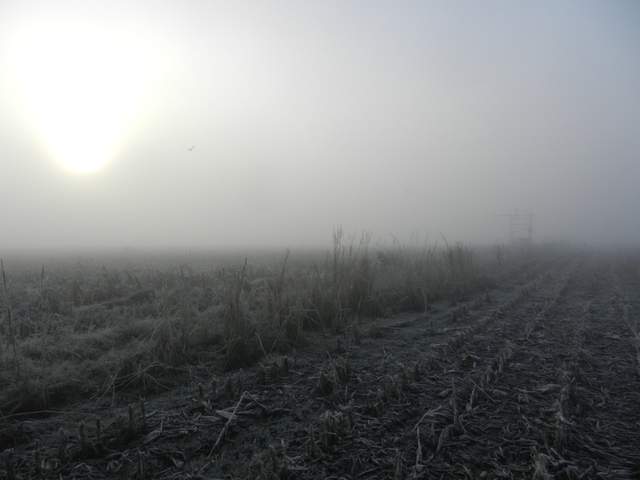
20130103DC_FrostAndFog.jpg ( 2013-01-03 09:30:13 ) Full size: 1920x1440
Eddy tower in morning frosty fog
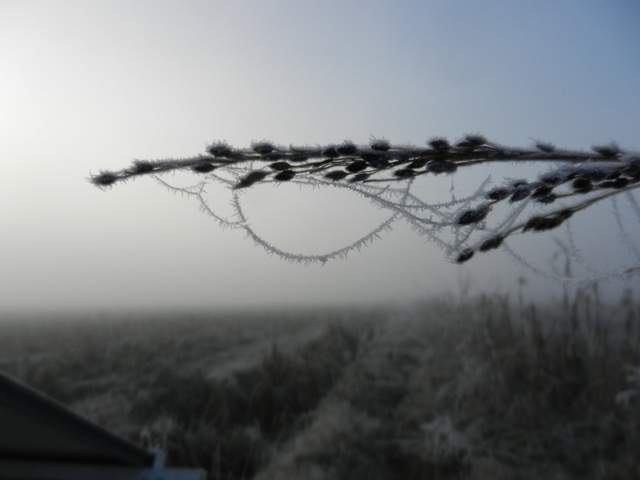
20130103DC_FrostedGrass.jpg ( 2013-01-03 09:32:04 ) Full size: 1920x1440
Icy spider webs on dead grass
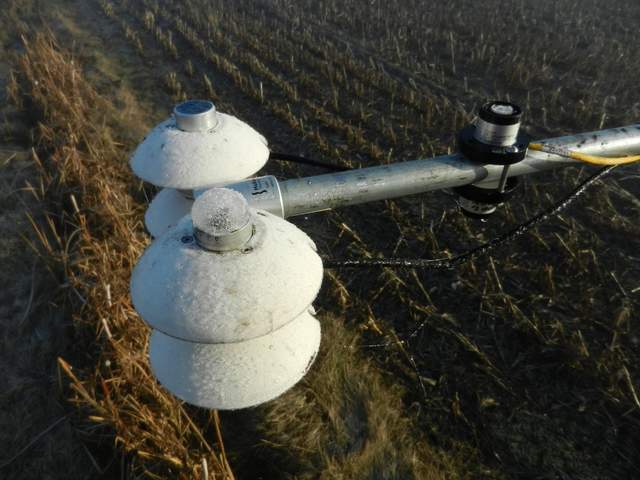
20130103DC_RadiometerFrost.jpg ( 2013-01-03 09:51:46 ) Full size: 1920x1440
Ice on radiometers
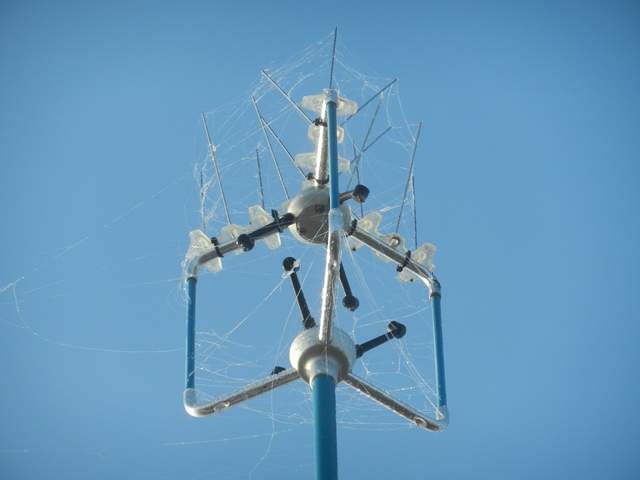
20130103DC_SonicSpiderWebs.jpg ( 2013-01-03 09:43:17 ) Full size: 1920x1440
Spider webs on Gill sonic head
3 sets found
Can't check DC_mixed
3 DC_mixed graphs found
7 DC_met graphs found
3 DC_flux graphs found

