Field Notes
<--2010-07-28 13:00:00 | 2010-08-05 12:50:00-->Other sites visited today: Sherman Island | Sherman Island | Twitchell Rice
Phenocam link: Searching...
Twitchell Rice: 2010-07-28 13:00:00 (DOY 209)
Author: Joe Verfaillie
Others: Jaclyn
| Twitchell
7/28/2010 Arrived about 1pm with Jaclyn. The weather was sunny, warm but not as windy as earlier at Sherman. The water level in the field was higher again. The rice looks okay, but quite a few aquatic weeds in the field. The weeds along the side of the field have jumped up in the last two weeks. The LRG was running is slow flow mode with the H2O and CH4 channels not having line locked. Restarting fixed it and gave readings: 12:05PST, 28.53C, 97.31Torr, 13.869usec, 10Hz, 1.8799ppm, 13502ppm, 378.60ppm I installed the LI7700. Swapped the CR1000 card and changed the program for the LI7700. I was intending to test out using the serial output from the LI7700 but just ran out of time. Before installing I cleaned the mirrors with kim wipes and alcohol resulting in an RSSI of about 88. I tried to calibrate the LGR but in slow flow mode the internal pressure was almost zero with almost no flow. Toggling low flow and high flow had no effect neither did a restart. Maybe I will swap it out with our CH4 analyzer next week. In high flow the pressure and values seemed okay after adjusting the bypass valve: 12:50PST, 29.03C, 143.16Torr, 13.856usec, 10Hz, 1.8458ppm, 13472ppm, 380.05ppm Jaclyn drilled some larger holes in the well pipe where the water level inside was lower than outside again. She also changed the desiccant in the pyranometer. The plantcam seems to be dead. It had only a few photos and would not turn on even with new batteries. I brought it in for testing. |
1 photos found

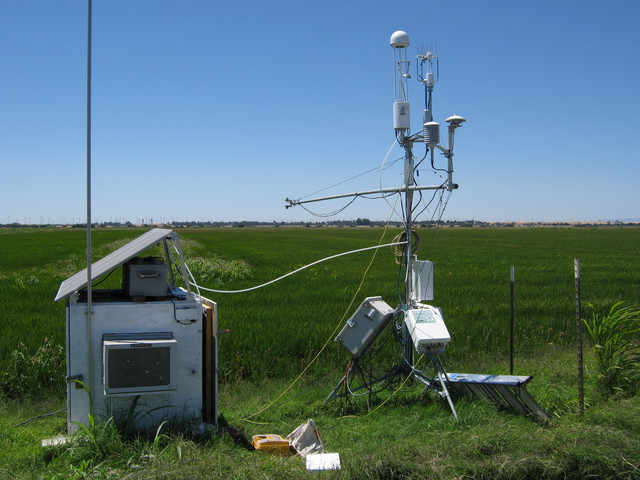
20100728TW_Site.jpg ( 2010-07-28 14:01:22 ) Full size: 3648x2736
Twitchell rice eddy tower and equipment box
6 sets found
12 TW_met graphs found
No data found for TW_flux.
Can't check TWSI_mixed
Can't check SIMBTWEE_met
No data found for TW_cam.
Can't check TATWBABCSB_cam

