Field Notes
<--2012-09-27 10:30:00 | 2012-10-11 10:00:00-->Other sites visited today: Sherman Island | Twitchell Rice | West Pond | DWR Corn
Phenocam link: Searching...
Mayberry: 2012-10-04 08:30:00 (DOY 278)
Author: Cove Sturtevant
Others: Sara
Summary: Solar panel mount may need adjustment for shorter days & lower sun angle. Moved portable tower to Location 1. All data looked good. Re-installed surface DO sensor. Took water samples.
| Portable Tower
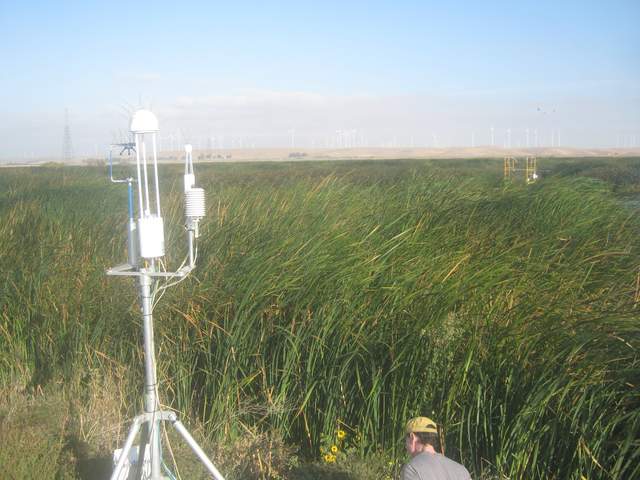
We arrived at about 08:30 PDT and moved the portable tower from Location 2 to Location 1. (We went to this site first today due to cow blockage on the road to Sherman. Cows seem pretty innocuous in the mind’s eye but when they’re moving at a swift clip down the road toward you, the impression changes considerably.) After the move, we noticed that the solar controller indicated low battery at ~11.9 V, 0 amps incoming solar power. I checked the wiring and all was well. The panel had a pretty thick layer of dust and we cleaned it but this didn’t help. At this early hour the sun angle was pretty low so we lowered the angle of the panel (which faces west) so it was more flat, but the orientation of the truck with current panel mount also caused most of the panel to be shaded by the cab. I thought about turning the truck around but then the panel would just be shaded by the tower itself for the entire day whereas shading by the cab would disappear after another hour or so. The best orientation would actually be to park the truck sideways so that the panel is angled toward the sun for the entire day, but the road is too narrow at this location. If this becomes a problem as the days get shorter, I would suggest changing the mount so that the panel can be angled toward the sun with the current truck orientation and raising it slightly to miss most of the cab shading in the morning. Another solution could be to move the panel to the end of the truck bed and turn the truck around. We turned off the load and let the system charge while we went to the permanent tower, returning around 9:30 PDT and turning the system back on. The incoming solar was only 0.3 amps. CH4 = 1.9 ppm RSSI = 24, bumped to 87 after cleaning. CO2 = initially fluctuating substantially, 388 ppm after cleaning H2O = 670 mmol m-3 after cleaning agc = initially fluctuating around 40, steady at 37.5 after cleaning cottony cattail material from path Permanent tower I checked the tower while Sara went into the water to collect water samples and re-install the surface DO sensor, which read ~ 22.5 after install. Current 7500 readings: CO2 = 388 ppm H2O = 600 mmol m-3 7700 readings: CH4 = 1.9 ppm RSSI = 28 (bumped to 78 after cleaning) MET values looked fine. 7700 reservoir was full. |
1 photos found

MB_autocam_20121004_0915.jpg ( 2012-10-04 09:15:02 ) Full size: 1920x1440
Cove on site
11 sets found
7 MB_flux graphs found
No data found for MB_met.
28 MB_tule graphs found
Can't check MBWPEESWGT_mixed
1 MB_cam graphs found
Can't check MBEEWPSWEPGT_cam
Can't check SIMBTWEE_met
No data found for MB_minidot.
Can't check MBSWEEWPBCBA
1 MB_processed graphs found
Can't check MB_fd
1 MB_fd graphs found

