Field Notes
<--2012-05-04 11:00:00 |
2012-05-24 10:30:00-->
Phenocam link:
Searching...Tonzi: 2012-05-18 09:00:00 (DOY 139)
Author: Siyan Ma
Others:
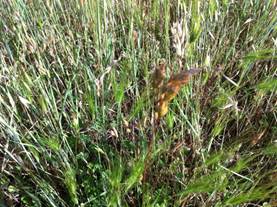
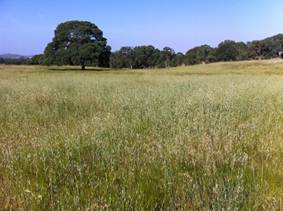
Summary: Grass becoming senescent, tree leaves complete, swapped 7500s at Tower and Vaira, data not collected.
When: Date: 5/18/2012 , Day: 139
, Watch Time: 9:00am .
Where: Tonzi/Vaira Ranch
Who: Siyan
Weather: clear and sunny
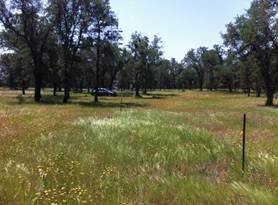
Phenology: grass became senescent, 10% at Vaira, 20-30%
at Tonzi. Oak leaves fully extended.
Summary
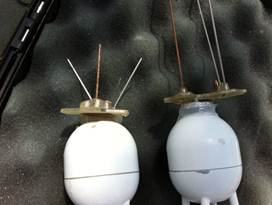
- Swapped Li-7500 at Vaira and Tower
- Checked data at Tower, Floor, and Vaira Three EC
systems worked well. (Data were not downloaded this time because I forgot
bringing memory stick. I will do it next visiting.)
- Calibrate Li-800 in the field. It went well.
- Collected grass samples for LAI
- dendrometers
- soil moisture
- spectrometer at Vaira
- groundwater well
Date
|
DOY
|
Location
|
Depth from the black thing (feet)
|
5/18/2012
|
139
|
Floor
|
23.2
|
|
|
Tower
|
27.7
|
|
|
roadside
|
36.9
|
Vaira_Grass Site
- Fence and gate power: 12 v.
- Panel and Batteries: 12.9 v; 7.1
amps; 2.9 amps.
- Reading from Gillsonic screen before downloading data.
(The value of H2O and CO2 should be in the range of
0 – 5 v.)
|
mean
|
std
|
|
mean
|
std
|
w
|
-0.04
|
0.315
|
Ts
|
17.7
|
0.685
|
u
|
0.54
|
0.826
|
H2O
|
2.329
|
0.061
|
v
|
1.44
|
0.724
|
CO2
|
2.141
|
0.035
|
- Check data files. No missing data.
- swaping Li-7500 Analyzer. (Remove SN# 73 ;
install SN# 42 )
- Check the fans of air temp. and relative humidity sensors
at Vaira. Yes!
- Check MD-9 system connections; Yes!
- Check levels of Radiation sensors, clear up surfaces.
- Check rain gage, make sure not clogged.
- Closed gate and set up fence.
Tonzi_Tower Site
- Fence and gate power: 12 v.
- Panel and Batteries: 12.9 v; 0.0
amps; 4.0 amps.
- Reading from Gillsonic screen before downloading data.
(The value of H2O and CO2 should be in the range of
0 – 5 v.)
|
mean
|
std
|
|
mean
|
std
|
w
|
-0.36
|
0.544
|
Ts
|
20.8
|
0.351
|
u
|
2.14
|
0.768
|
H2O
|
2.504
|
0.036
|
v
|
0.15
|
0.929
|
CO2
|
2.127
|
0.018
|
- check data files. No missing data.
- swaping Li-7500 Analyzer. (Remove SN# 0418 ;
install SN# 1549 )
- check the fans of air temp. and relative humidity sensors
on the tower and the floor. Yes.
- Check rain gage, make sure not clogged.
- Check calibration cylinders;
CO2 1250 psig;
flow 20 psi; 421.63 ppm.
N2 1700
psig; flow 20 psi.
Is the pump running Yes.
- close gate and set up fence.
Toniz_Floor Site
- Fence and gate power: 12 v.
- Panel and Batteries: 14.1 v; 11.2
amps; 1.7 amps.
- Reading from Gillsonic screen before downloading data.
(The value of H2O and CO2 should be in the range of
0 – 5 v.)
- check data files. No missing data.
- I was planning to swap Li-7500 Analyzer. However, I had to
swap it back because the CO2 channel of IRGA (#35) showed -0.0001. The
set of IRGA was newly calibrated by Li-cor, and it was working well when I
recalibrated in the lab on 5/17/2012.
- Check MD-9 system connections. Yes. All worked well.
- Close gate and set up fence.
tonzi
|
7931AFE
|
402165
|
574B4B
|
402FF3
|
574632
|
7A432E
|
7A3C6E
|
7A3B40
|
7A4AAA
|
5/18/2012
|
139
|
|
|
|
|
|
|
|
|
|
sm
|
|
|
|
|
|
|
|
|
0-15
|
13.4
|
9.7
|
15.0
|
11.5
|
11.1
|
4.6
|
12.7
|
6.1
|
6.4
|
15-30
|
17.5
|
14.8
|
19.7
|
17.0
|
12.7
|
45.6
|
18.2
|
19.6
|
5.9
|
30-45
|
25.7
|
29.0
|
22.9
|
27.6
|
26.0
|
14.3
|
18.4
|
24.4
|
22.0
|
45-60
|
24.8
|
37.4
|
39.4
|
58.6
|
11.1
|
16.9
|
28.8
|
38.3
|
18.2
|
|
|
|
|
|
|
|
|
|
|
|
A6D882B
|
A3D04E8
|
A6D72F5
|
|
|
|
|
|
|
|
|
|
|
|
|
|
|
|
|
0-15
|
12.1
|
8.3
|
9.4
|
|
|
|
|
|
|
15-30
|
12.3
|
2.0
|
20.3
|
|
|
|
|
|
|
30-45
|
22.1
|
22.1
|
26.8
|
|
|
|
|
|
|
45-60
|
37.0
|
42.9
|
51.1
|
|
|
|
|
|
|
|
|
|
|
|
|
|
|
|
|
vaira
|
57318a
|
7933dee
|
00000128B97F3
|
00000128B8072
|
00000128BDDE8
|
|
|
|
0-15
|
broken
|
4.3
|
5.15
|
2.1
|
0.75
|
|
|
|
|
15-30
|
broken
|
11.6
|
8.25
|
4.4
|
4.65
|
|
|
|
|
30-45
|
broken
|
16.4
|
5.2
|
10.3
|
13.85
|
|
|
|
|
45-60
|
broken
|
28.8
|
18.2
|
9.3
|
18.95
|
|
|
|
|
Tonzi
|
|
|
|
|
Dendrometer
|
|
|
|
|
|
|
|
|
Date
|
Day
|
Tag
#
|
Reading
(mm)
|
|
5/18/2012
|
139
|
72
|
11.1
|
|
|
|
79
|
9.9
|
|
|
|
102
|
12.3
|
|
|
|
245
|
9.9
|
|
|
|
250
|
X
|
(reset to 10.5 on May 7, 2009)
|
|
|
1
|
20.3
|
|
|
|
2
|
16.3
|
|
|
|
3
|
17.3
|
|
|
|
4
|
4.
|
|
|
|
5
|
23.0
|
|
|
|
7
|
16.5
|
133
|
|
|
8
|
18.0
|
11828
|
|
|
71
|
X
|
|
|
|
77
|
X
|
|
|
|
78
|
X
|
|
|
|
248
|
X
|
broken
|
|
|
255
|
X
|
|
|
|
252
|
X
|
|
|
|
6
|
X
|
|
|
|
|
|
|
|
|
|
|
Notes: “X” means not working any more.
|
Field Data
No tank data
Well Depth
| Date | Location | Depth (feet) |
|---|
| 2012-05-18 | TZ_floor | 23.2 |
| 2012-05-18 | TZ_road | 32.9 |
| 2012-05-18 | TZ_tower | 27.7 |
No TZ Moisture Point data found
No VR Moisture Point data found
No TZ grass heigth found
No VR grass heigth found
Tree DBH
| Date | Tag# | Reading (mm) |
|---|
| 2012-05-18 | 1 | 20.3 |
| 2012-05-18 | 102 | 12.3 |
| 2012-05-18 | 2 | 16.3 |
| 2012-05-18 | 245 | 9.9 |
| 2012-05-18 | 3 | 17.3 |
| 2012-05-18 | 4 | 4 |
| 2012-05-18 | 5 | 23 |
| 2012-05-18 | 7 | 16.5 |
| 2012-05-18 | 72 | 11.1 |
| 2012-05-18 | 79 | 9.9 |
| 2012-05-18 | 8 | 18 |
No water potential data found
No TZ Grass Biomass data found
No TZ OakLeaves Biomass data found
No TZ PineNeedles Biomass data found
0 photos found
16 sets found
No data found for TZ_Fenergy.
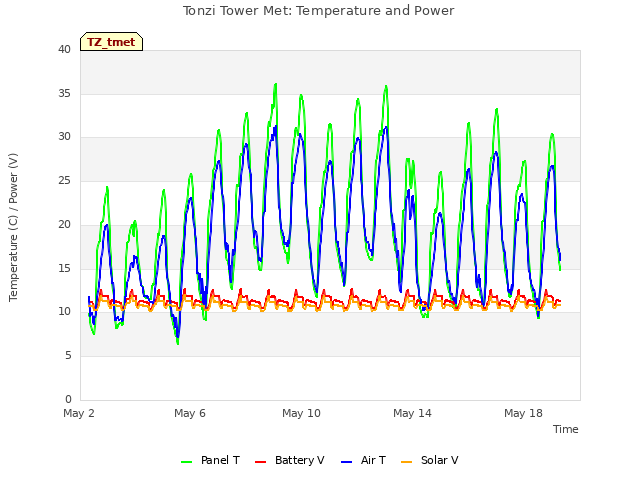
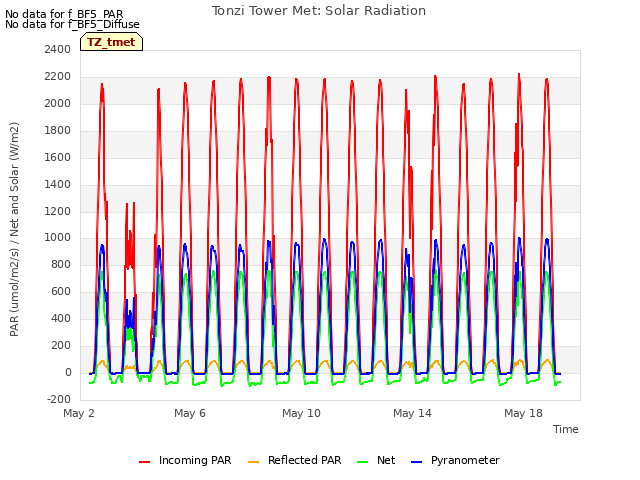
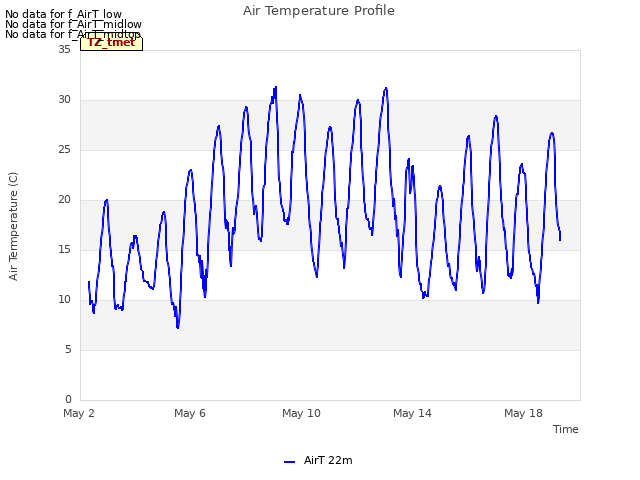
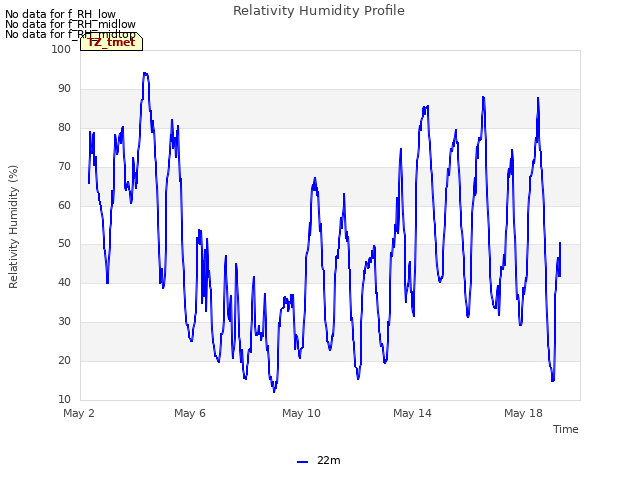
11 TZ_tmet graphs found


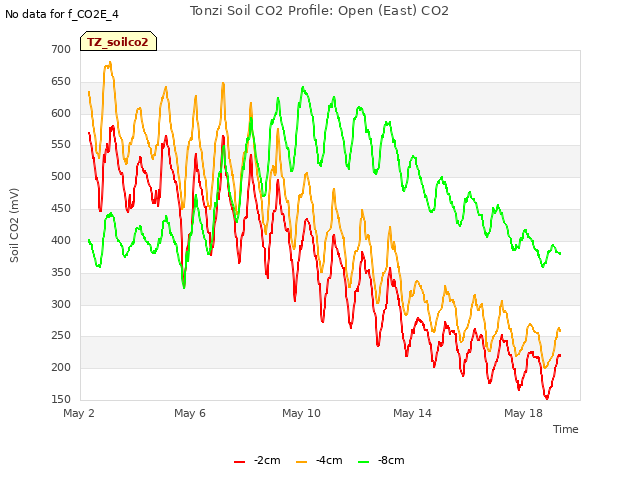
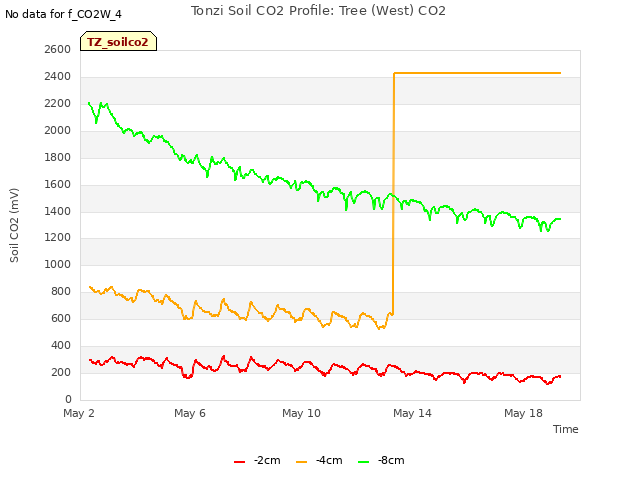
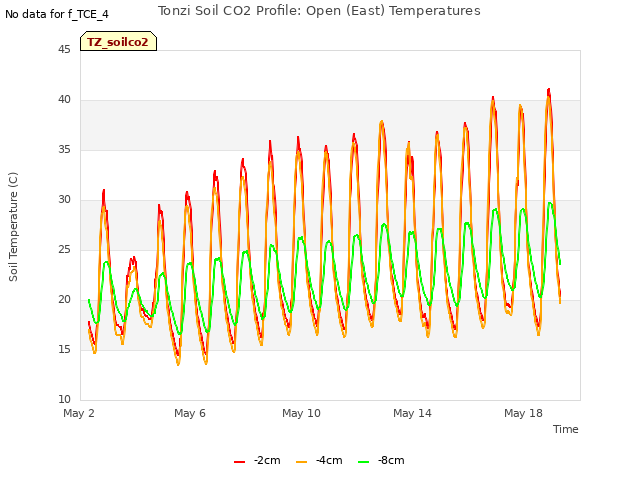
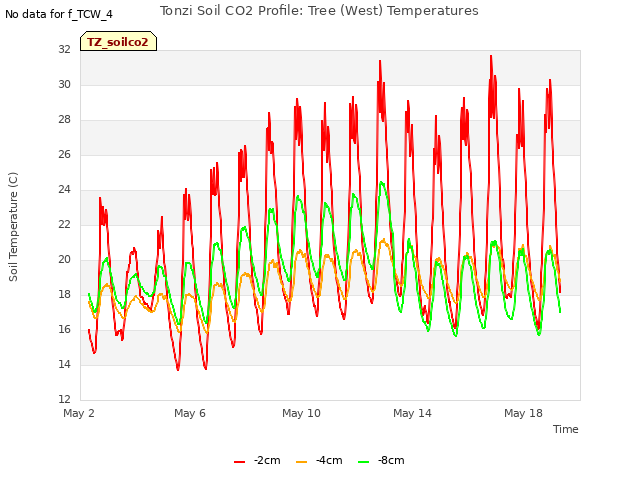
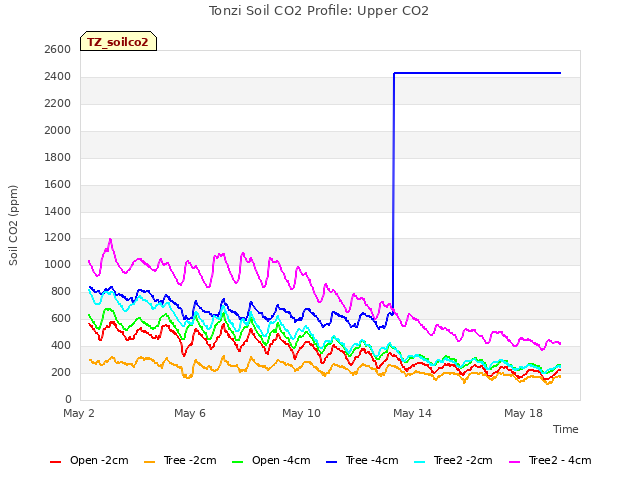
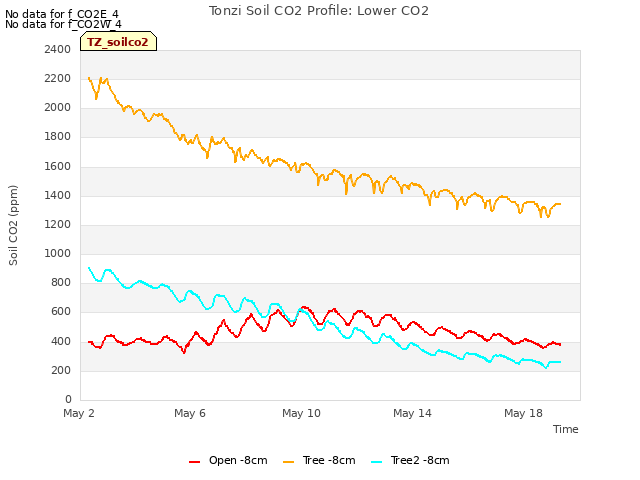
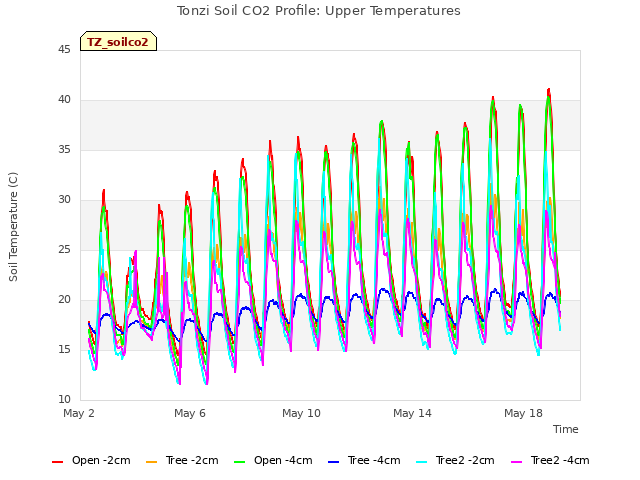
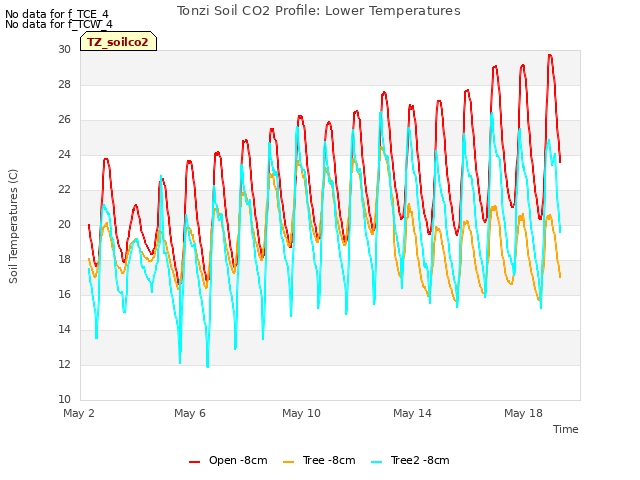
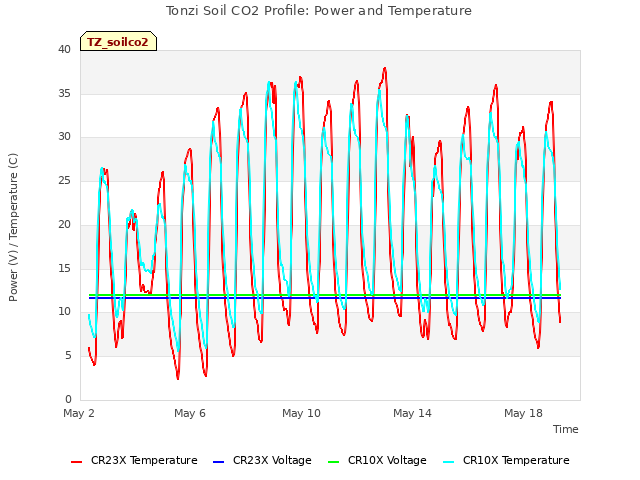
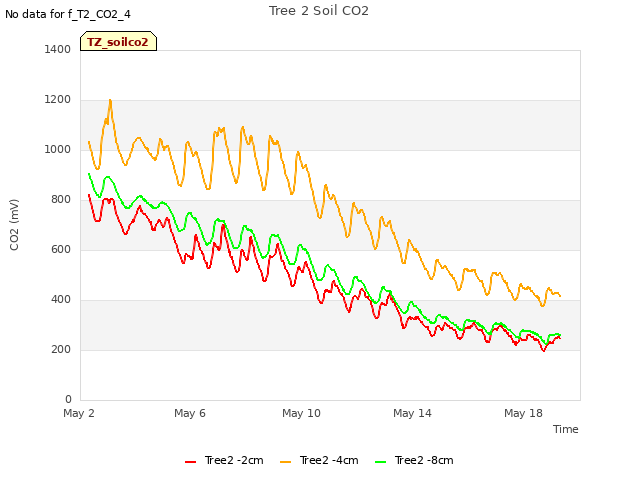
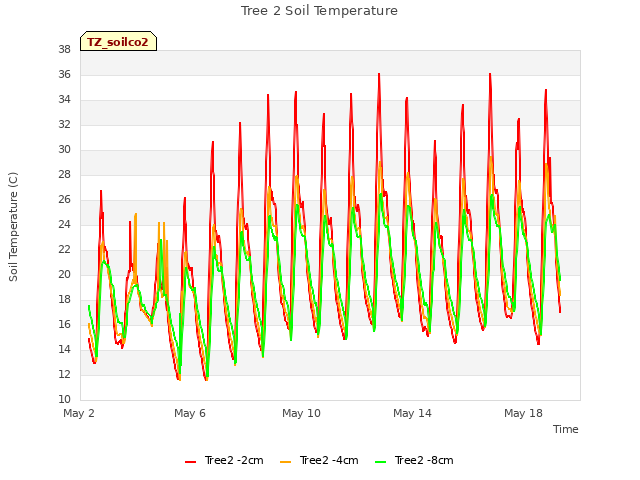
11 TZ_soilco2 graphs found
Can't check TZ_mixed
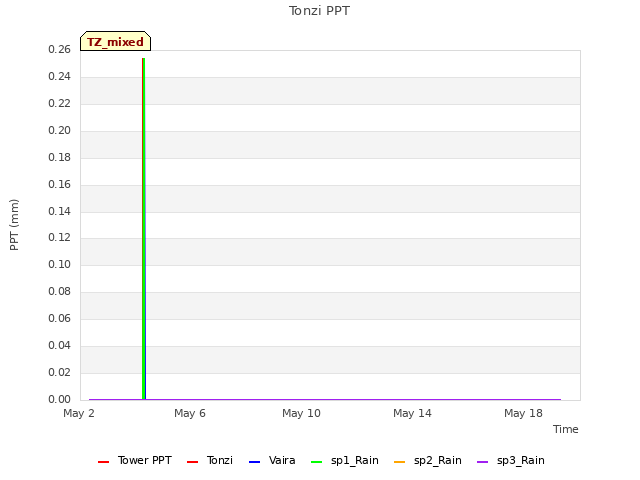
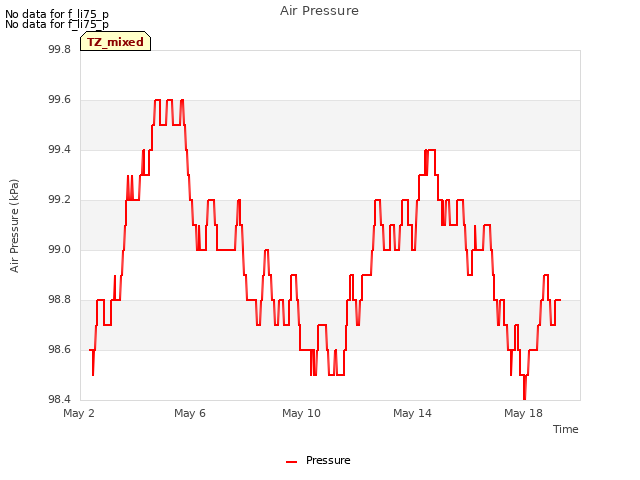
3 TZ_mixed graphs found

1 TZ_fflux graphs found

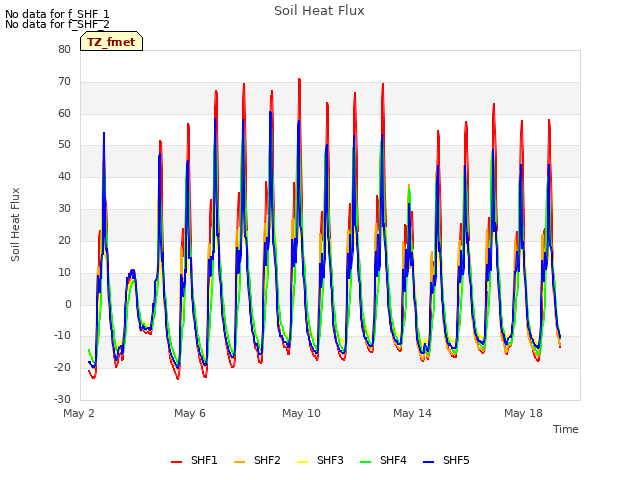
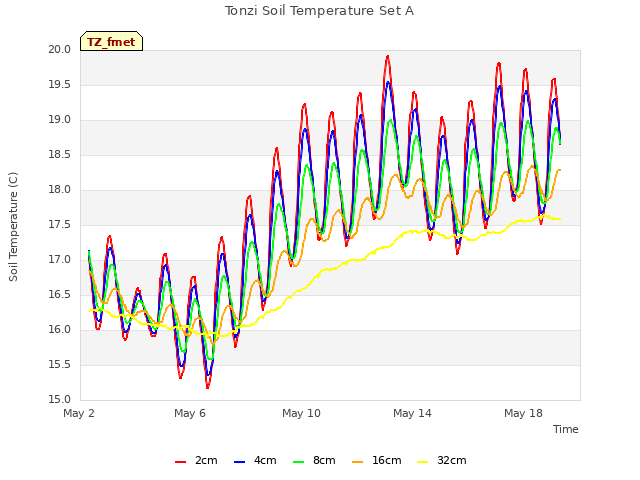
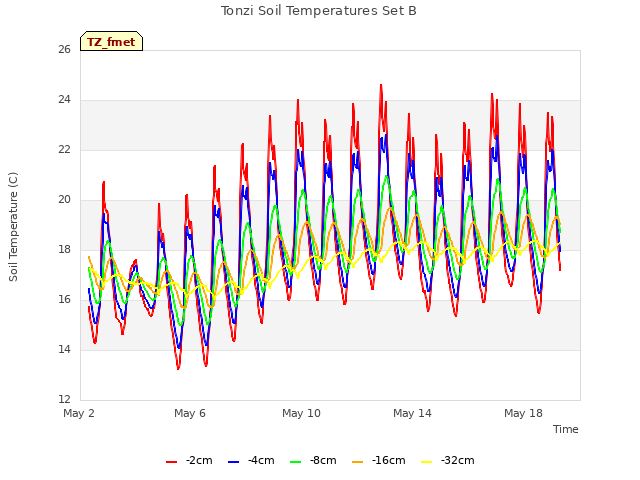
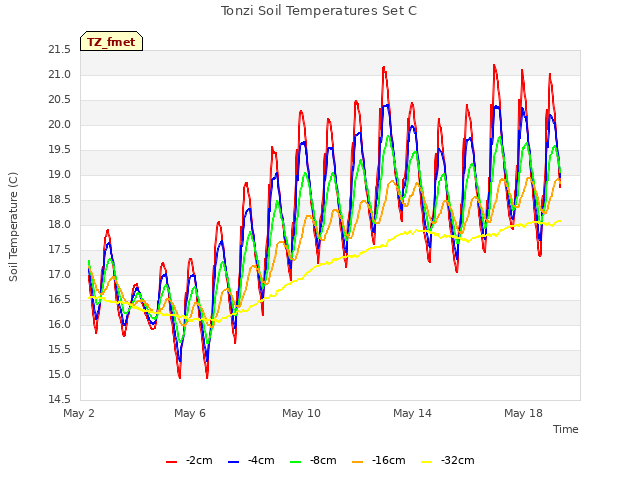
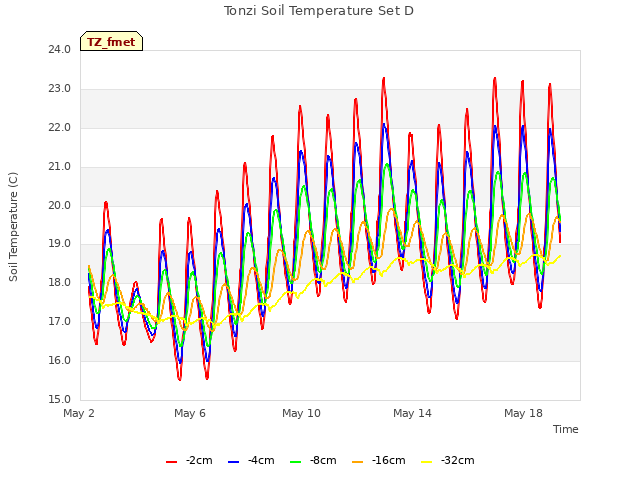
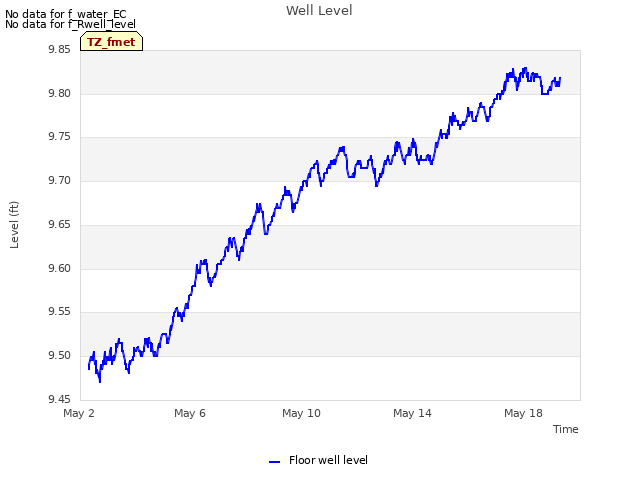
8 TZ_fmet graphs found


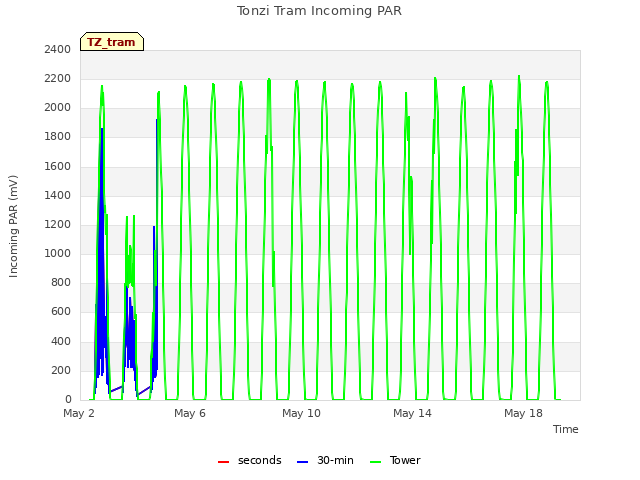
1 TZ_tram graphs found
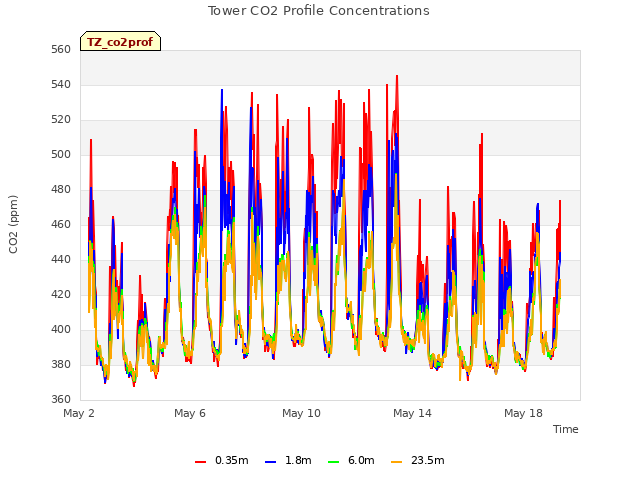
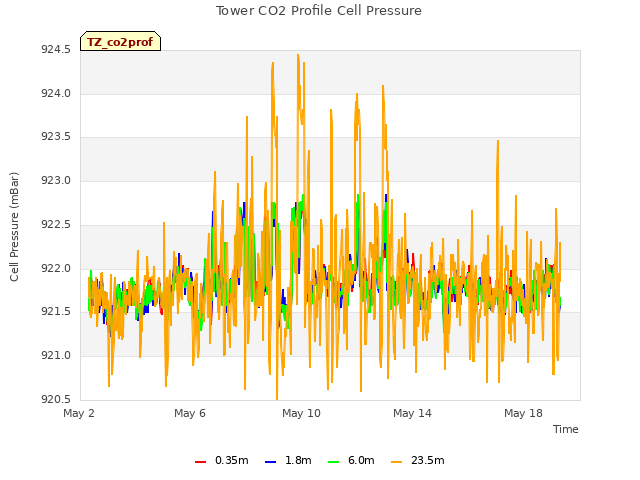
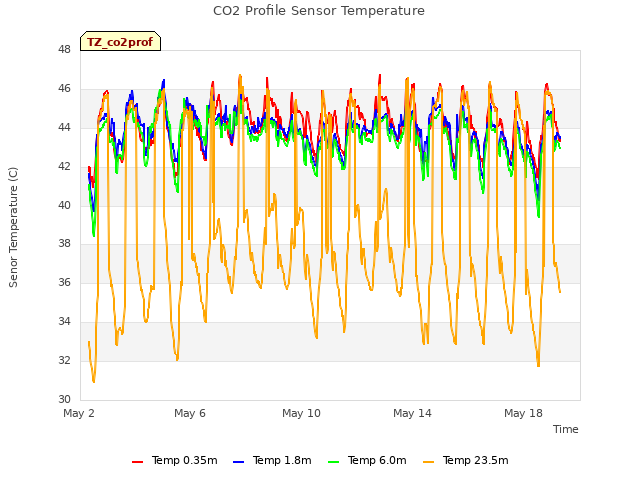
3 TZ_co2prof graphs found
No data found for TZ_irt.
No data found for TZ_windprof.
1 TZ_tflux graphs found

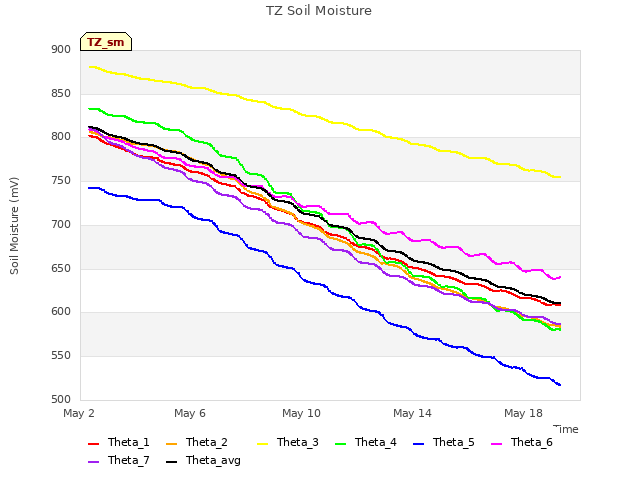
2 TZ_sm graphs found

Can't check TZ_met
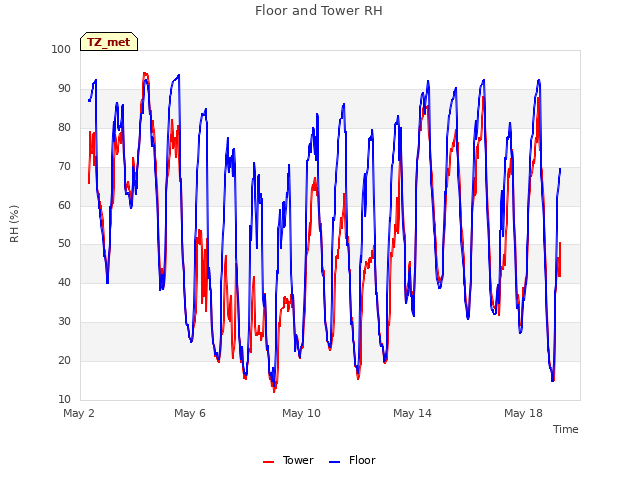
1 TZ_met graphs found
Can't check TZVR_mixed
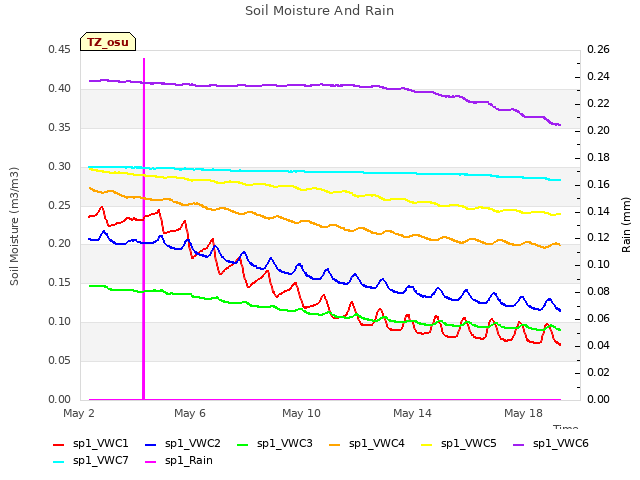
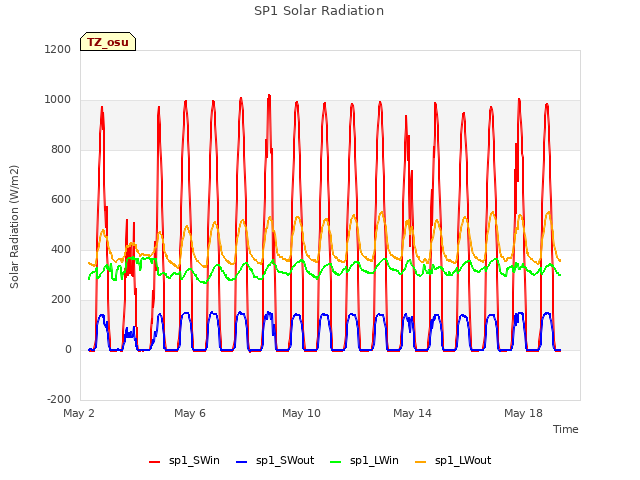
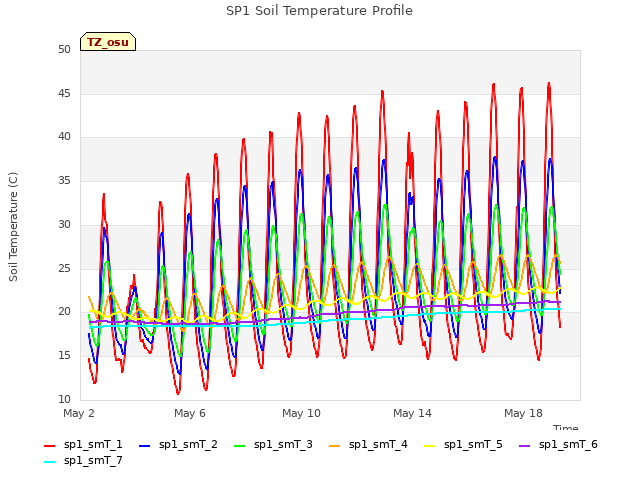
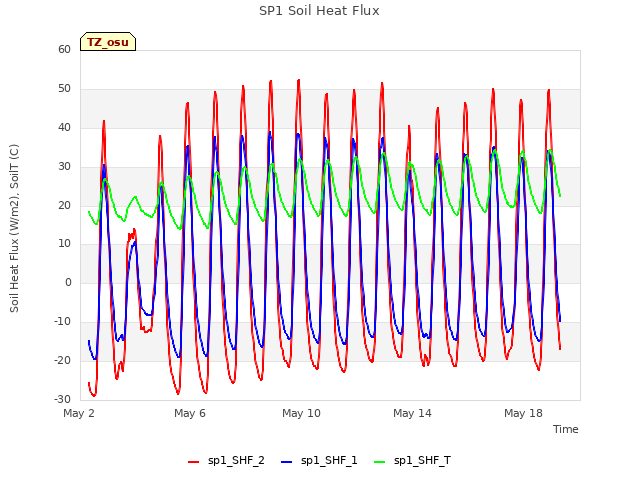
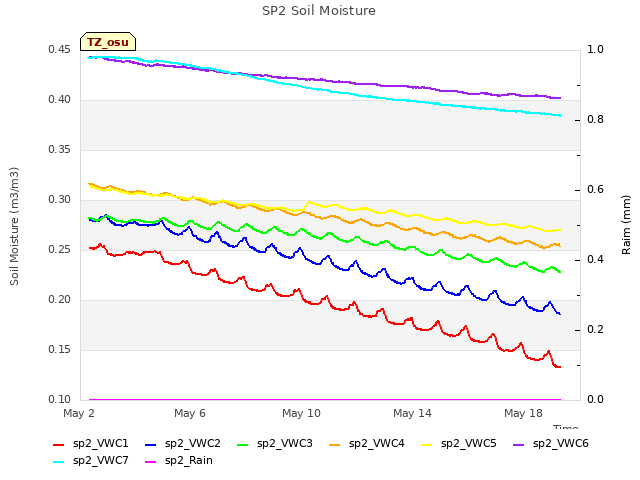
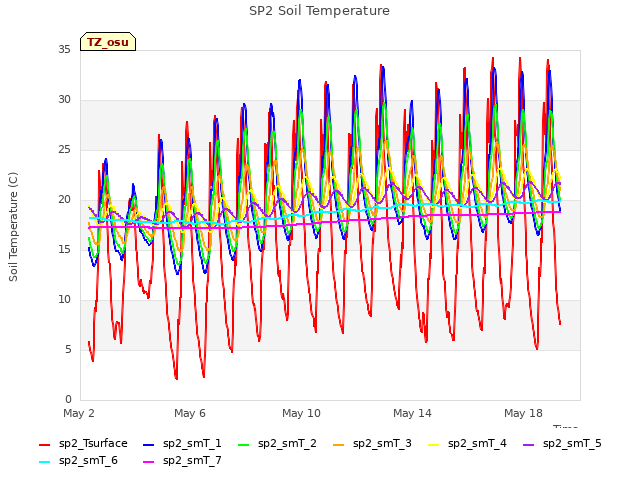
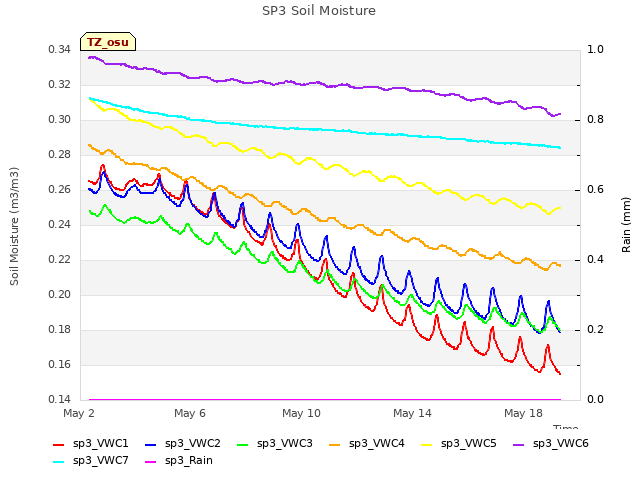
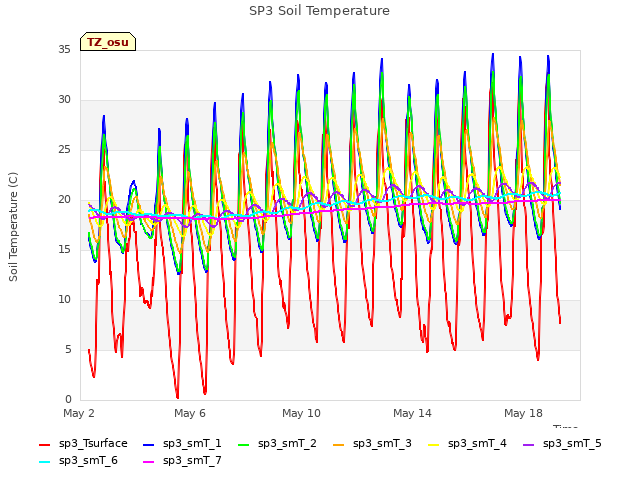
8 TZ_osu graphs found
No data found for TZ_fd.
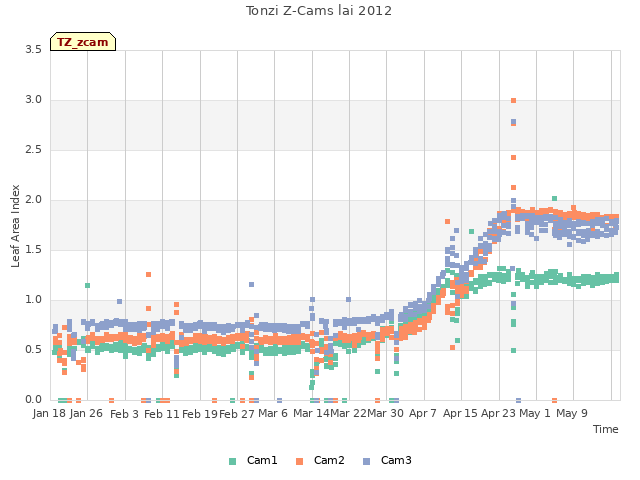
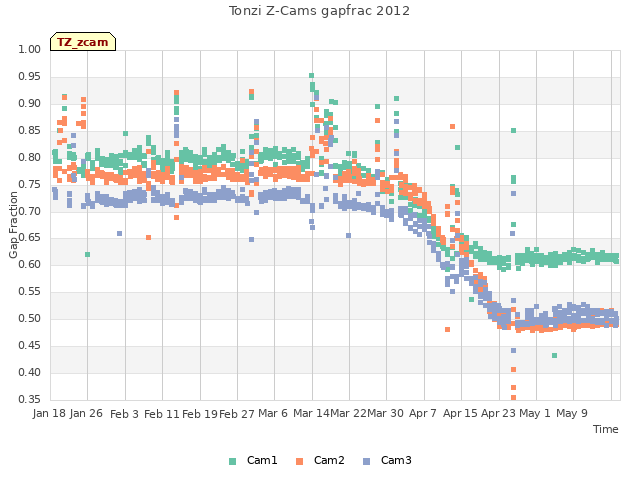
Tonzi Z-cam data