Field Notes
<--2011-09-16 09:00:00 | 2011-09-29 10:00:00-->Other sites visited today: Vaira
Phenocam link: Searching...
Tonzi: 2011-09-23 10:00:00 (DOY 266)
Author: Joe Verfaillie
Others: Dennis, Naama, Sara
Summary: EMI survey, Tower IRGA blocked by bird dropping - cleaned, Floor computer okay, Dead tree list, changed z-cam programs.
| Tonzi
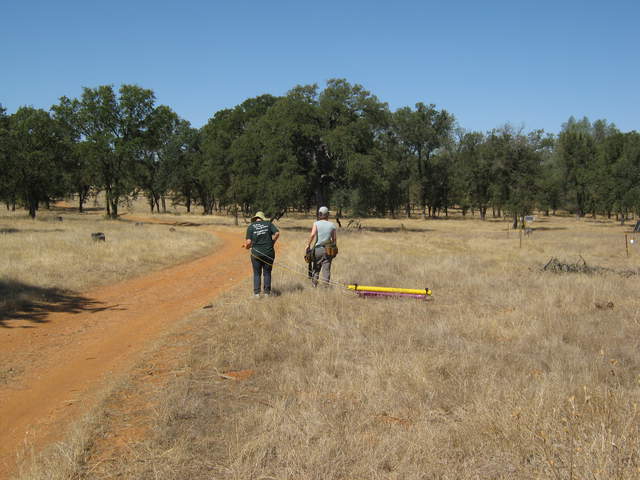
2011-09-23 I arrived about 10PST with Dennis, Naama and Sara. It was clear, sunny, and hot. There is still water in Tonzi?s pond, but the ground is very dry. The trees still look good, but are beginning to lose leaves and there are acorns on the ground. We did an EMI survey. The EMI sensor was bolted to a plastic snow sled with plastic bolts. This held the sensor?s center about 15cm above the ground. When dragging the sled the GPS unit was about 2.5m in front of the center of the EMI sensor. Naama and Sara dragged the area to the north of the dirt road. Sara and I and Dennis dragged the area south of the road. It was difficult to stay on line and avoid rocks, down trees, and litter cages. Maybe next time I can add a layer to the GPS with pre ?defined lines. Also would be better to mount GPS antenna at the middle of the sled. The tower IRGA?s path was blocked bird droppings about two days after our last visit a week ago. I cleaned the IRGA?s windows and extended the bird spikes on the top. The bird spikes on the sonic were also pushed to the side. I fixed this when I remounted the IRGA. I checked on the Floor computer and it seemed to be running just fine. I made no changes. I changed the programs on the z-cams to take images at 30 minute intervals (instead of 60 minute) before sunset. Naama recorded GPS positions of root pits. We noticed a number of dead trees: Tag number Notes 230 Near Floor, lots of gopher holes 291 North of Floor site 11851 11859 11860 Three trunks of same tree 11861 Three trunks of same tree 11862 Three trunks of same tree 12044 12231 12307 12437 11935 12054 12173 Pine 12174 Pine |
Field Data
No tank data
No TZ Well data found
No TZ Moisture Point data found
No VR Moisture Point data found
No TZ grass heigth found
No VR grass heigth found
No TZ Tree DBH found
No water potential data found
No TZ Grass Biomass data found
No TZ OakLeaves Biomass data found
No TZ PineNeedles Biomass data found
4 photos found

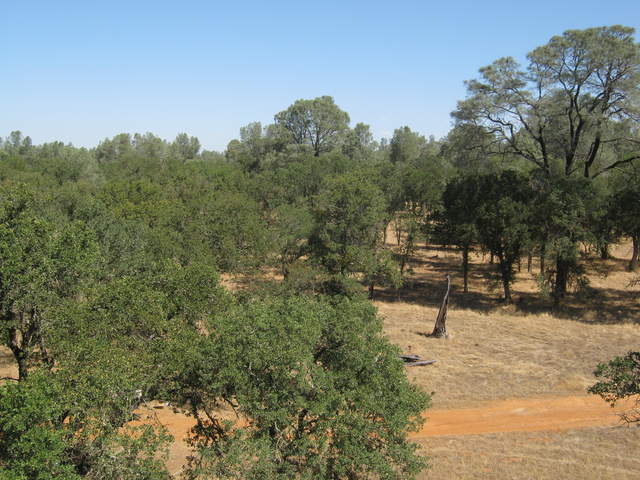
20110923TZ_Canopy.jpg ( 2011-09-23 12:20:24 ) Full size: 3648x2736
View at canopy height from tower

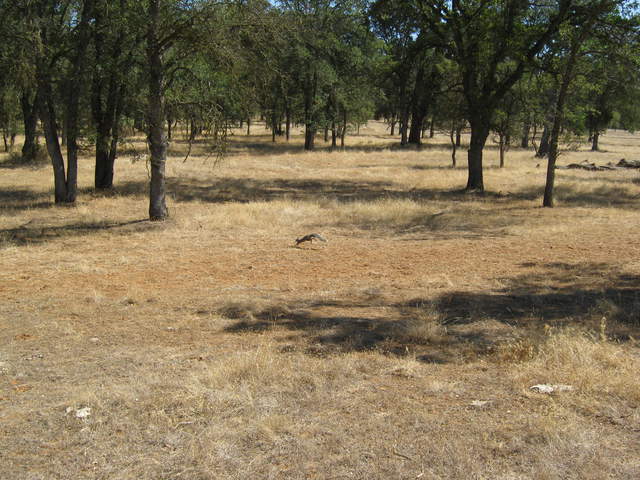
20110923TZ_GraySquirrel.jpg ( 2011-09-23 12:36:27 ) Full size: 3648x2736
Gray squirrel

20110923TZ_NaamaSaraEMI.jpg ( 2011-09-23 12:25:04 ) Full size: 3648x2736
Naama and Sara pulling EMI sled

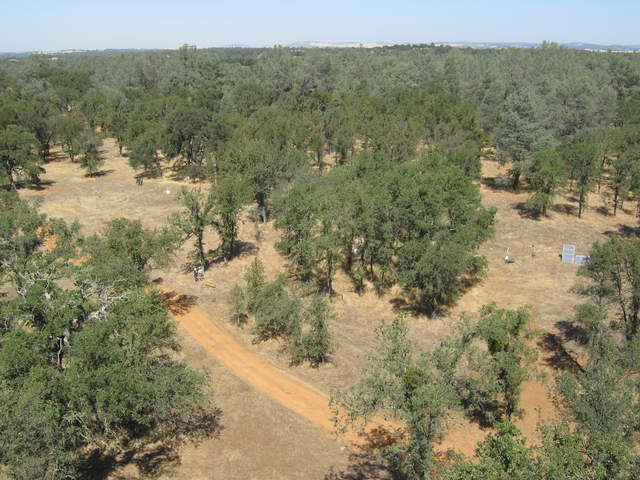
20110923TZ_ViewFromTowerEMI.jpg ( 2011-09-23 12:17:23 ) Full size: 3648x2736
View of floor sites from tower top
16 sets found
No data found for TZ_Fenergy.
11 TZ_tmet graphs found
11 TZ_soilco2 graphs found
Can't check TZ_mixed
3 TZ_mixed graphs found
1 TZ_fflux graphs found
8 TZ_fmet graphs found
1 TZ_tram graphs found
3 TZ_co2prof graphs found
No data found for TZ_irt.
No data found for TZ_windprof.
1 TZ_tflux graphs found
2 TZ_sm graphs found
Can't check TZ_met
1 TZ_met graphs found
Can't check TZVR_mixed
No data found for TZ_osu.
No data found for TZ_fd.
Tonzi Z-cam data

