
Field Notes
<--2009-02-27 00:00:00 | 2009-03-12 10:00:00-->Other sites visited today: Tonzi
Phenocam link: Searching...
Tonzi: 2009-02-27 00:00:00 (DOY 58)
Author: Joe Verfaillie
Others:
| Tonzi 2-27-2009
1) New pump for CO2 profile installed. 2) Cal panel for web cam installed in lower left corner of image. 3) Radiation Railroad Robot reinstalled. The controlling program has been completely rewritten and still has a few bugs in it. The car is now always parked at the charging stations until the beginning of the half hour. From 7am to 7pm PST, at the beginning or each half hour the will travel down the track and back once. Initial data indicates that it takes 707 seconds out and 695 seconds return. There are two data lines on the output data. Lines starting with 10 are output at the end of each pass and include standard deviations. Lines starting with 100 are the 1Hz data output. Headers: 1 10 ArrayID End of Pass output 2 Year_RTM year 3 Day_RTM day of year 4 Hour_Minute_RTM HHMM PST 5 Seconds_RTM seconds 6 LapLoc Lap location counts up on the way out down on return 7 Battery_AVG Battery voltage (V) 8 PAR_in_AVG Incoming PAR (mV) 9 PAR_out_AVG Outgoing (reflected) PAR (mV) 10 Net_AVG Net radiation (mV) 11 dir_AVG Direction 1 = out (westward), 2 = return (eastward) 12 PAR_in_STD STD of incoming PAR 13 PAR_out_STD STD of outgoing PAR 14 Net_STD STD net radiation 15 timer counter incremented each time the program runs (1Hz) 1 100 ArrayID 1Hz output 2 Year_RTM year 3 Day_RTM day of year 4 Hour_Minute_RTM HHMM PST 5 Seconds_RTM seconds 6 LapLoc Lap location counts up on the way out down on return 7 Battery Battery voltage (V) 8 PAR_in Incoming PAR (mV) 9 PAR_out Outgoing (reflected) PAR (mV) 10 Net Net radiation (mV) 11 dir Direction 1 = out (westward), 2 = return (eastward) Known bugs: duplicate output of records at start and end of passes. This comes from multiple detections of proximity sensors. 4) Added two Apogee SI-121 sensors to the top of the tower, wired into the CR23x6 data logger. The program on this data logger was changed removing the ghost calibration instruments and adding the two SI-121s. The SI-121s require a single ended and a differential channel each. New wiring: 9H Grn sn1282 9L Grn sn 1281 G Blu sn 1281 and Blu sn 1282 10H Red sn 1282 10L Blk sn 1282 G Clr sn 1282 11H Red sn 1281 11L Blk sn 1281 G Clr sn 1281 EX1 Wht sn 1282 EX2 Wht sn 1281 New headers for the CR23x6 data table: 1 ArrayID 100 2 Year_RTM 3 Day_RTM 4 Hour_Minute_RTM L 5 Panel_T_AVG 6 Batt_Volt_AVG 7 Pricip_mm_TOT 8 ParUp_1_AVG 9 ParDn_1_AVG 10 Pyran_1_AVG 11 NetRad_1_AVG 12 TAir_1_AVG 13 RH_1_AVG 14 ParUp_1_STD 15 ParDn_1_STD 16 Pyran_1_STD 17 NetRad_1_STD 18 TAir_1_STD 19 RH_1_STD 20 sys_volt1_AVG 21 mV_thrm1_AVG thermistor output sn 1282 (mV) 22 mV_thrm2_AVG thermistor output sn 1281 (mV) 23 mV_tpile1_AVG thermopile output sn 1282 (mV) 24 mV_tpile2_AVG thermopile output sn 1281 (mV) 25 mV_thrm1_STD thermistor output sn 1282 (mV) 26 mV_thrm2_STD thermistor output sn 1281 (mV) 27 mV_tpile1_STD thermopile output sn 1282 (mV) 28 mV_tpile2_STD thermopile output sn 1281 (mV) 29 SB_Temp_1_AVG calculated body temperature sn 1282 (C) 30 SB_Temp_2_AVG calculated body temperature sn 1281 (C) 31 T_Temp_1_AVG calculated target temperature sn 1282 (C) 32 T_Temp_2_AVG calculated target temperature sn 1281 (C) 33 SB_Temp_1_STD calculated target temperature sn 1282 (C) 34 SB_Temp_2_STD calculated target temperature sn 1281 (C) 35 T_Temp_1_STD calculated target temperature sn 1282 (C) 36 T_Temp_2_STD calculated target temperature sn 1281 (C) Calculations: Thermistor resistance from half bridge measurement R_thrm = (1/mV_thrm – 1) * 24900 Steinhart-Hart equation for temperature from thermistor resistance 1/Td = A + B ln(R_thrm) + C (ln(R_thrm))^3 where Td is detector temperature for Apogee SI-121 A = 0.001129, B = 0.234108, C = 87.7547 Stefan-Boltzmann Law as formulated by Kalma et al Ag. For. Met. 1988 Tt^4 – Td^4 = m * mV + b where mV = DIFF mV thermopile output and Tt is target temperture Tt = (Td^4 + m *mV + b)^0.25 m = mC2 * Td^2 + mC1 * Td + mC0 mC2, mC1, mC0 = cal const for sensor b = bC2 * Td^2 + bC1 * Td + bC0 bC2, bC1, bC0 = cal const for sensor |
Field Data
No tank data
Well Depth
| Date | Location | Depth (feet) |
|---|---|---|
| 2009-02-27 | TZ_floor | 30.12 |
| 2009-02-27 | TZ_road | 36.26 |
| 2009-02-27 | TZ_tower | 34.72 |
No TZ Moisture Point data found
No VR Moisture Point data found
No TZ grass heigth found
No VR grass heigth found
Tree DBH
| Date | Tag# | Reading (mm) |
|---|---|---|
| 2009-02-27 | 1 | 10.3 |
| 2009-02-27 | 102 | 8.3 |
| 2009-02-27 | 2 | 8.5 |
| 2009-02-27 | 245 | 6.1 |
| 2009-02-27 | 250 | 15.1 |
| 2009-02-27 | 3 | 12.6 |
| 2009-02-27 | 4 | 3.9 |
| 2009-02-27 | 5 | 10.4 |
| 2009-02-27 | 6 | 6.2 |
| 2009-02-27 | 7 | 11.6 |
| 2009-02-27 | 72 | 12.9 |
| 2009-02-27 | 79 | 17.4 |
| 2009-02-27 | 8 | 12.8 |
No water potential data found
No TZ Grass Biomass data found
No TZ OakLeaves Biomass data found
No TZ PineNeedles Biomass data found
2 photos found
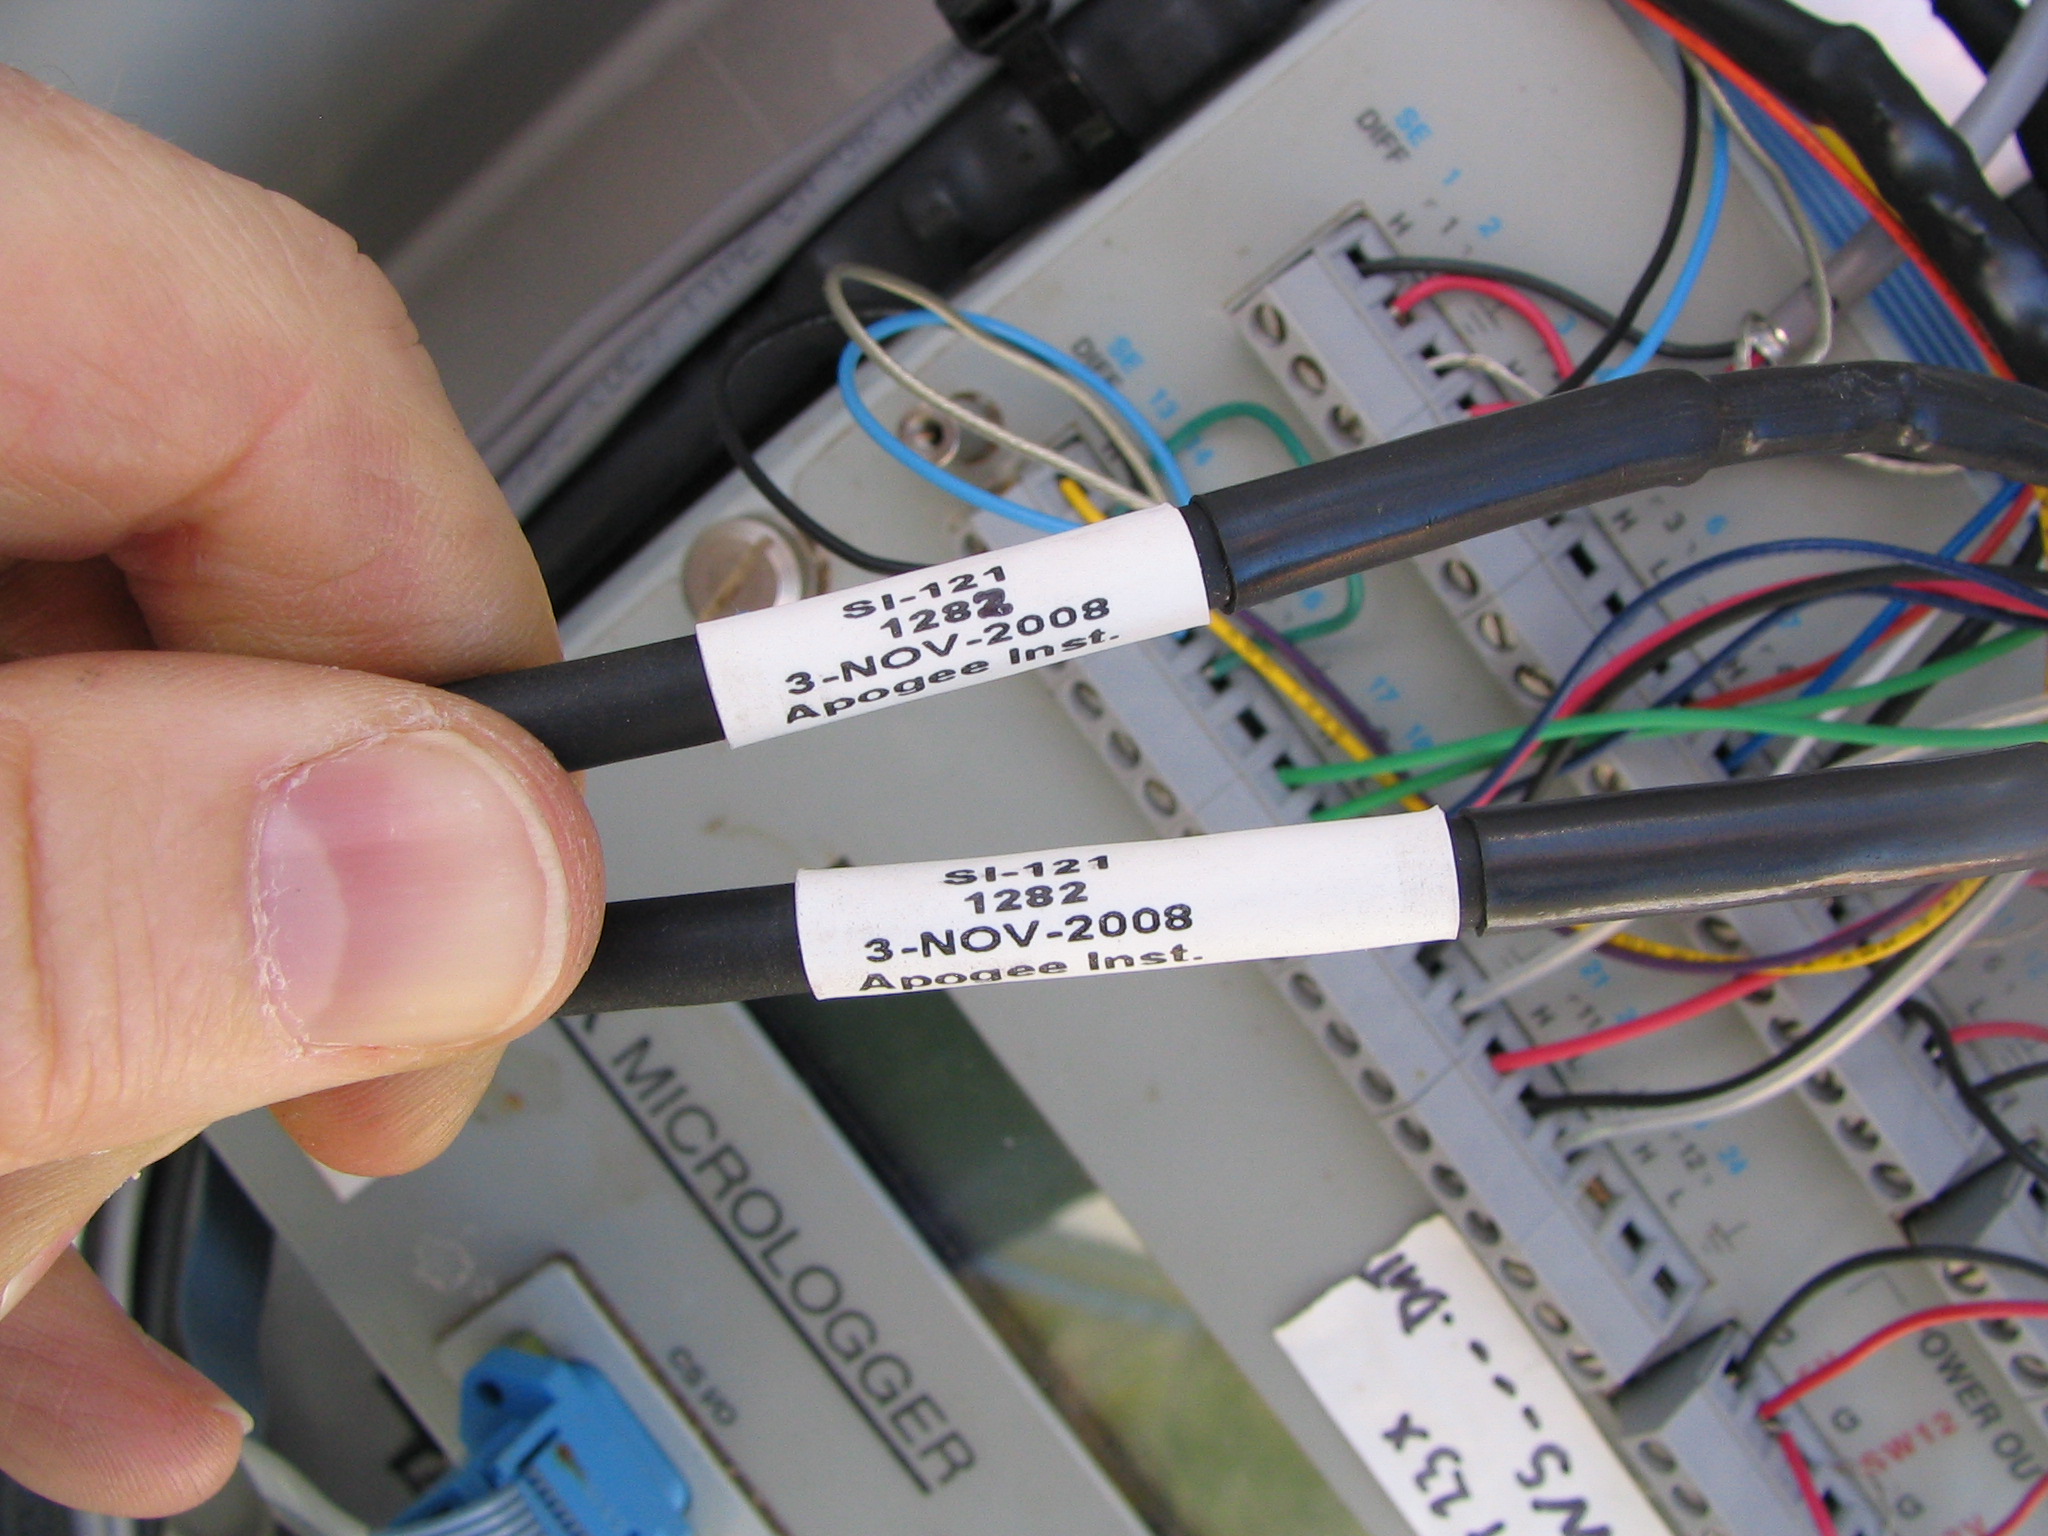
20090227TZ_ApogeeSerialNos.jpg ( 2009-02-27 14:39:38 ) Full size: 2048x1536
Serial Numbers on new Apogee IR surface temperature sensors. Hand written one is wrong.
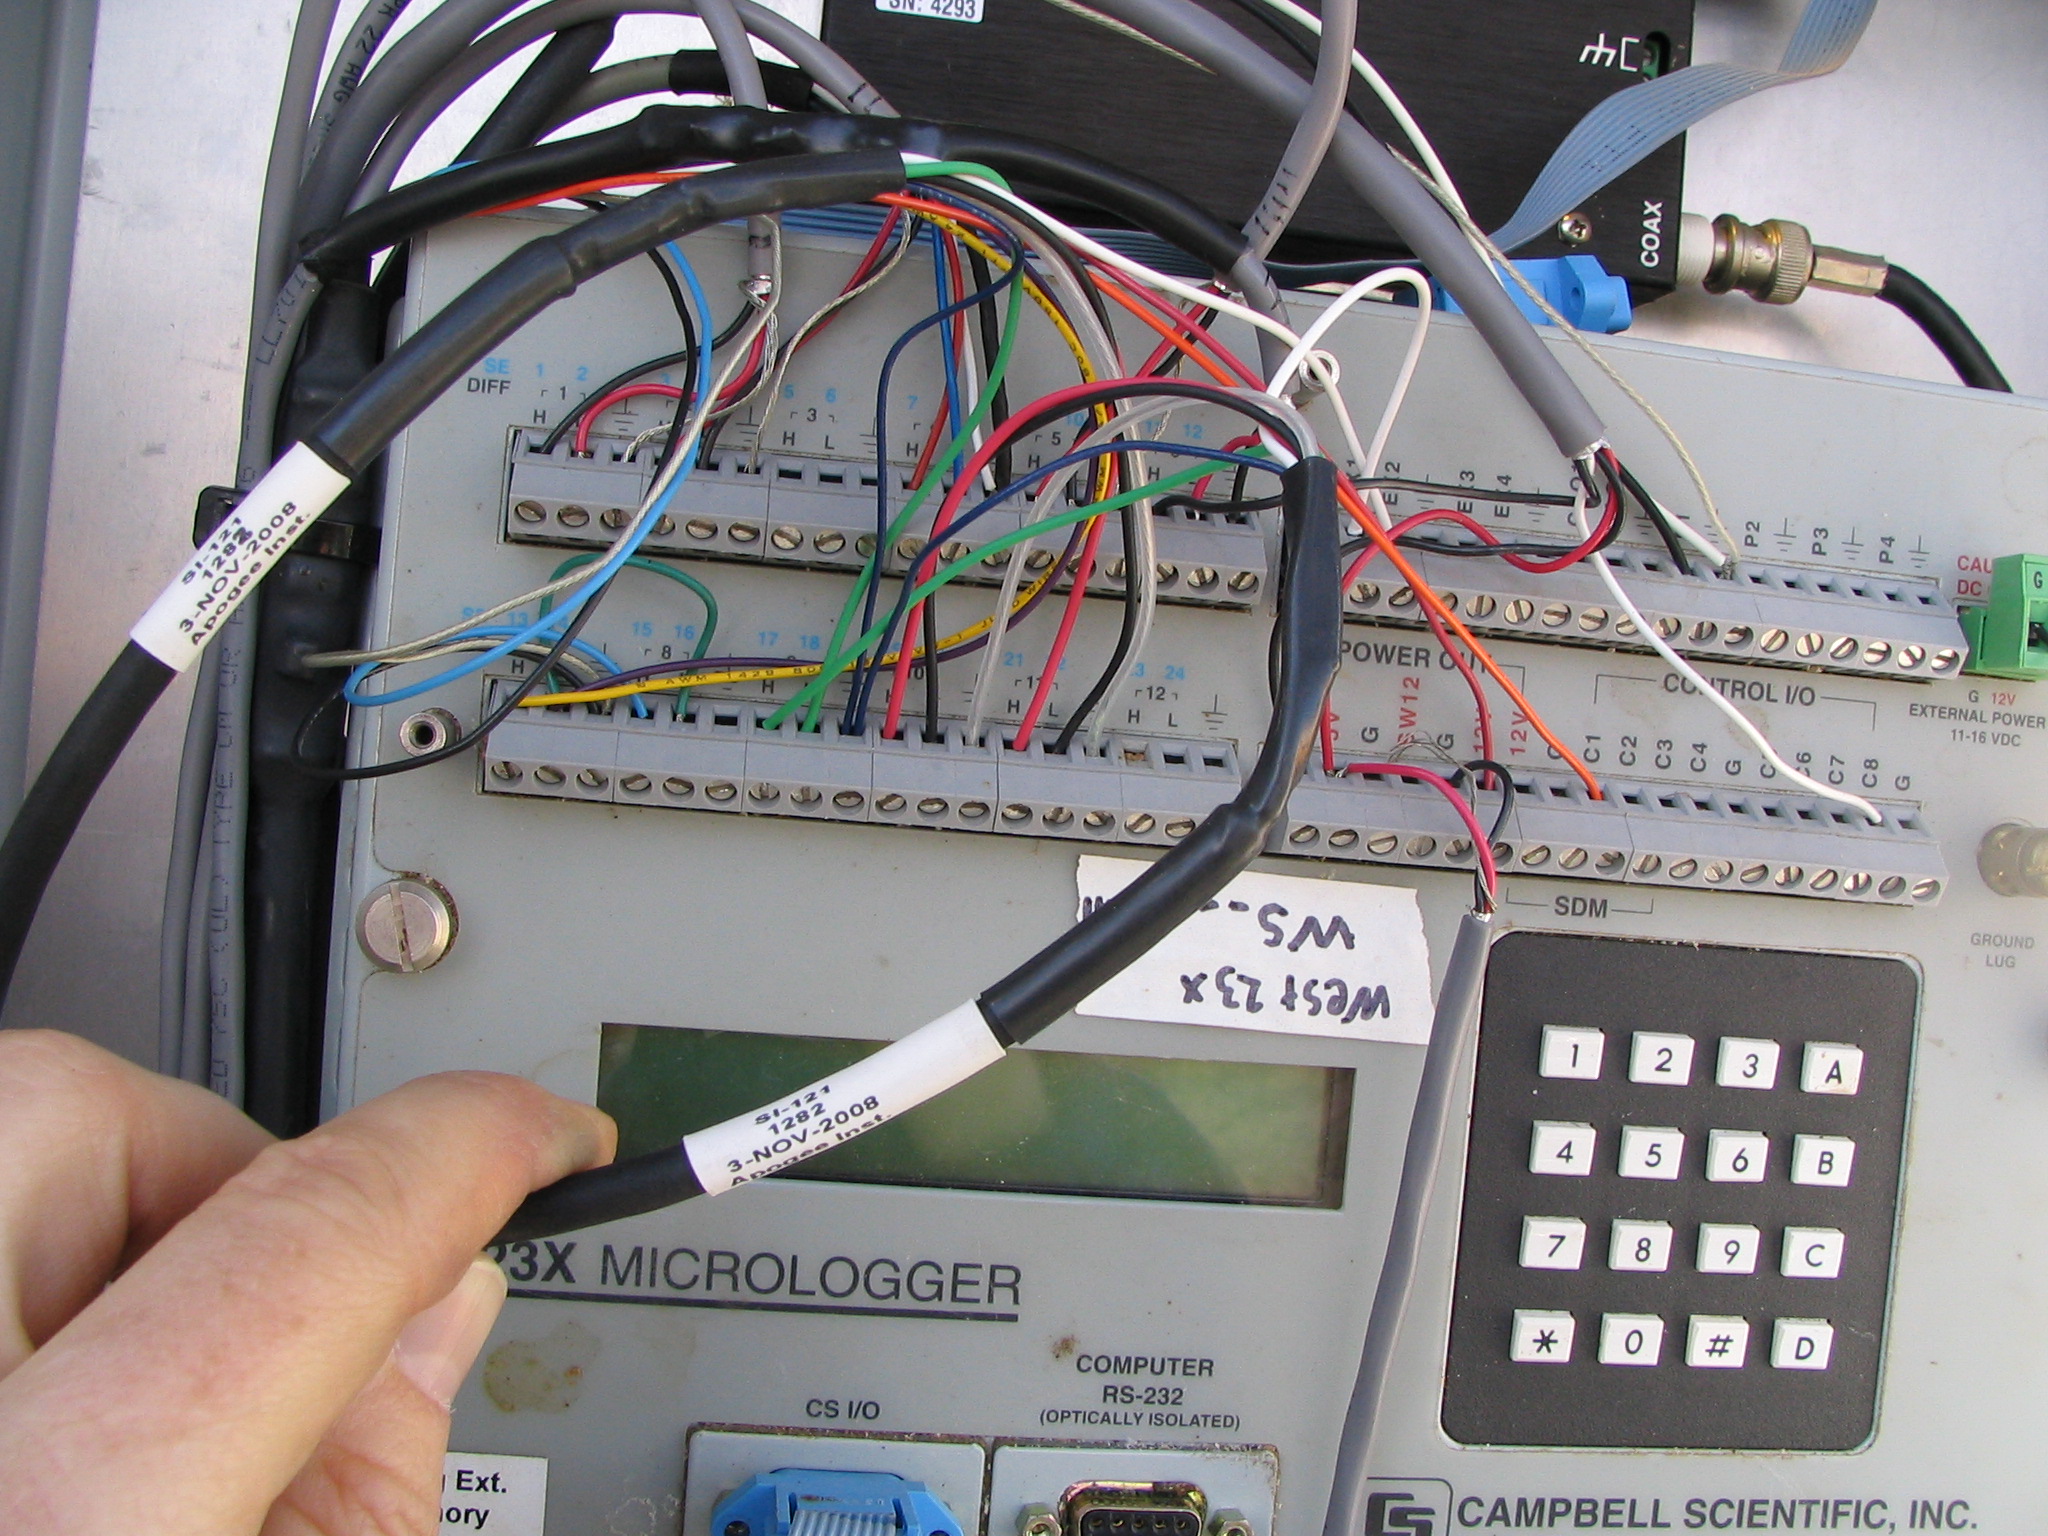
20090227TZ_23xWiring.jpg ( 2009-02-27 14:40:12 ) Full size: 2048x1536
Serial numbers an wiring of new Apogee IR surface temperature sensors.
16 sets found
No data found for TZ_Fenergy.
11 TZ_tmet graphs found
11 TZ_soilco2 graphs found
Can't check TZ_mixed
3 TZ_mixed graphs found
No data found for TZ_fflux.
8 TZ_fmet graphs found
No data found for TZ_tram.
3 TZ_co2prof graphs found
No data found for TZ_irt.
No data found for TZ_windprof.
No data found for TZ_tflux.
2 TZ_sm graphs found
Can't check TZ_met
1 TZ_met graphs found
Can't check TZVR_mixed
No data found for TZ_osu.
No data found for TZ_fd.
Tonzi Z-cam data