Field Notes

<--2011-05-10 08:20:00 | 2011-06-03 10:30:00-->
Other sites visited today: Sherman Island
Phenocam link: Searching...

Tonzi: 2011-05-27 09:30:00 (DOY 147)
Author: Siyan Ma
Others: Dennis, University of Michigan

Summary: Standard field work and met with University of Michigan group intersted in soil moisture.


5/27/2011

Siyan, Dennis, and visitors from University of Michigan working on soil moisture network (wireless, Radar)

Cloudy day, nice
Grassland still green

Summary
  1. Dennis took soil moisture measurements
  2. I downloaded data from the three PCs. The three towers worked well.
  3. We need a new N2 tank for CO2 profile system. (let Joe know already.)
  4. No met data lost at the Floor site. (now filename format: tz*_*_2011147.*, thanks, Joe!)


Tonzi

Vaira

Storage area near tower

Dennis and University of Michigan folks looks at rocks at Vaira

Dennis at Tower base with UM person

Grassy hill at Vaira


Vaira
Vaira Gill sonic plots screen before downloading data
Screen shot of Vaira data logger table


Tower
Tower Gill sonic plots screen before downloading data


Calibrate CO2 profile system: N2 = almost 0 psi; CO2 = 384.08 ppm, 1300psi, 20 psi.

Readings
Screen shot of Li-800 calibration pre-cal

Calibrate IRGA

Zero
Screen shot of Li-800 calibration zero pre-cal

Span
Screen shot of Li-800 calibration span pre-cal

Floor
Floor Gill sonic plots screen before downloading data Screen shot of tower met data logger table
Screen shot of floor met data logger table
Screen shot of soil moisture data logger table

Other data:

Soil moisture probes:

tonzi

7931AFE

402165

574B4B

402FF3

574632

7A432E

7A3C6E

7A3B40

7A4AAA

5/27/2011

147


ddb


0-15

13.6

9.9

18.1

10.7

15.0

#DIV/0!

16.5

11.2

8.4

15-30

17.4

13.8

22.8

16.0

11.5

23.2

20.7

17.3

6.4

30-45

20.9

17.7

#DIV/0!

20.1

12.7

25.5

16.9

20.3

17.3

45-60

25.7

17.1

#DIV/0!

32.9

14.8

50.7

21.2

30.6

14.0


A6D882B

A3D04E8

A6D72F5


0-15

16.8

11.6

14.5


15-30

13.5

3.2

19.6


30-45

19.1

18.2

15.9


45-60

21.4

23.7

19.4


vaira

57318a

7933dee

00000128B97F3

00000128B8072

00000128BDDE8


0-15

broken

11.9

12.4

2.1

2.3


15-30

broken

17.3

10.2

7.6

5.7


30-45

broken

17.0

3.26666667

12.4

16.666667


45-60

broken

27.9

15.2333333

6.76666667

17.5


Groundwater
Plot of water level depth 2006-2011
Dendrometers

5/27/2001

2011

147

245

17.9

5/27/2001

2011

147

250

14.5

5/27/2001

2011

147

102

4.8

5/27/2001

2011

147

79

11.6

5/27/2001

2011

147

72

19.2

5/27/2001

2011

147

2

14.6

5/27/2001

2011

147

3

11.6

5/27/2001

2011

147

6

21.8

5/27/2001

2011

147

4

15.9

5/27/2001

2011

147

7

12.3

5/27/2001

2011

147

8

6.1

5/27/2001

2011

147

1

12.1


Midday water potential

Plot of leaf water potential 2008-2010

Field Data

No tank data

Well Depth

DateLocationDepth (feet)
2011-05-27TZ_floor12.13
2011-05-27TZ_road21.77
2011-05-27TZ_tower17.29

No TZ Moisture Point data found

No VR Moisture Point data found

No TZ grass heigth found

No VR grass heigth found

No TZ Tree DBH found

Water Potential - mode: raw

TimeSpeciesTreereadings (bar)
2011-05-27 12:02:00 OAK UNKNOWN -9.1 -9.5 -16 -7.5 -20 -23.9 -17 -27 -31
2011-05-27 12:02:00 PINE UNKNOWN -9 -19.5 -25 -6 -6 -14

No TZ Grass Biomass data found

No TZ OakLeaves Biomass data found

No TZ PineNeedles Biomass data found

6 photos found
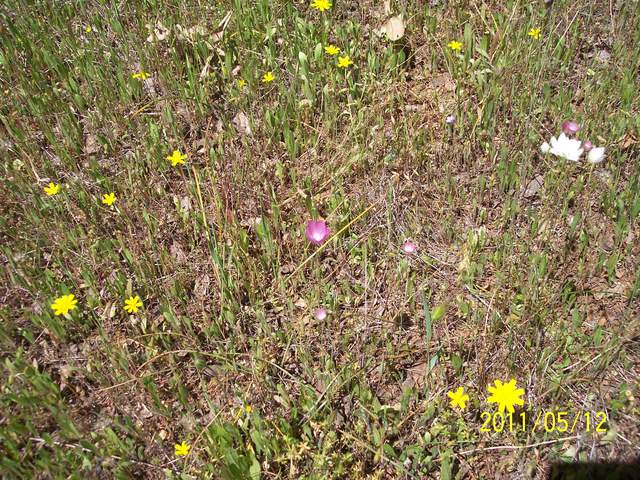
Yellow, white and pink wild flowers
TZ_native_sp7.jpg ( 2011-05-27 11:04:06 ) Full size: 1496x1122
Yellow, white and pink wild flowers
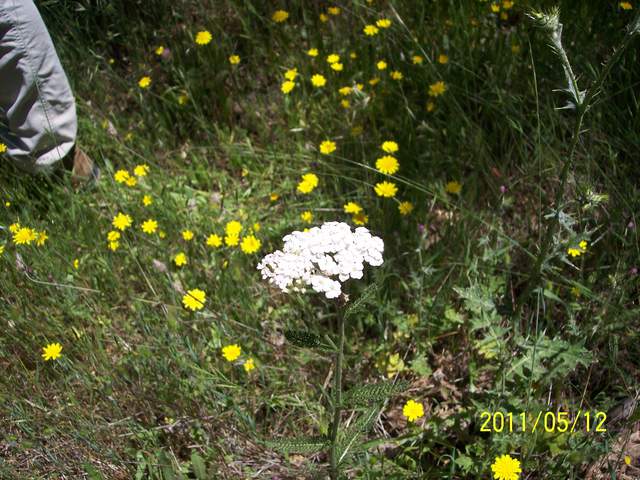
White and yellow wild flowers
TZ_native_sp6.jpg ( 2011-05-27 10:52:55 ) Full size: 1496x1122
White and yellow wild flowers
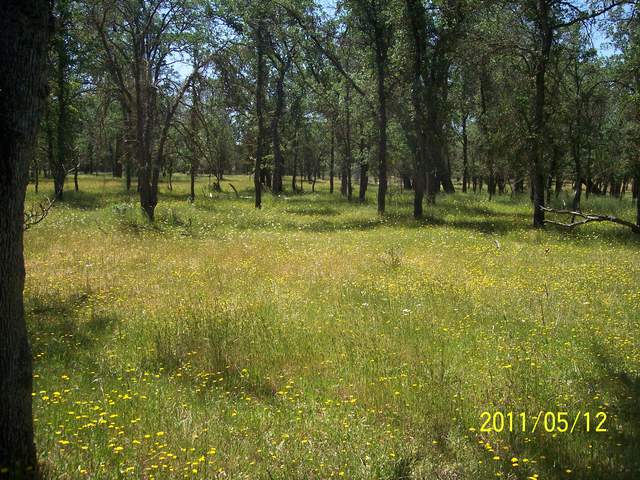
Green grass and flowers in the oak woodland
TZ_flower_patches.jpg ( 2011-05-27 10:35:35 ) Full size: 1496x1122
Green grass and flowers in the oak woodland
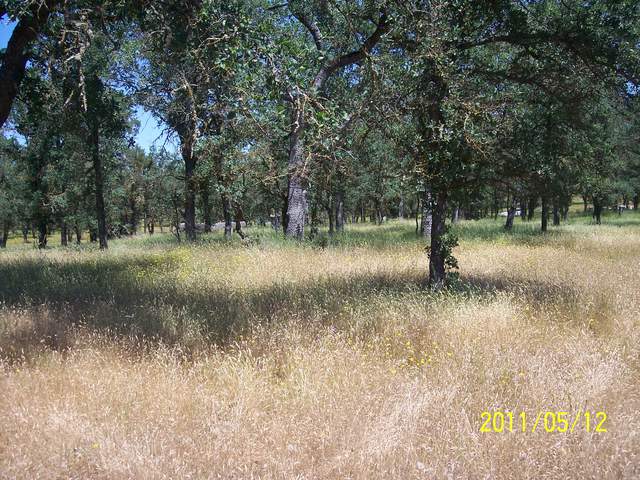
Brown grass in the oak woodland
TZ_drought_patch_2.jpg ( 2011-05-27 12:44:41 ) Full size: 1496x1122
Brown grass in the oak woodland
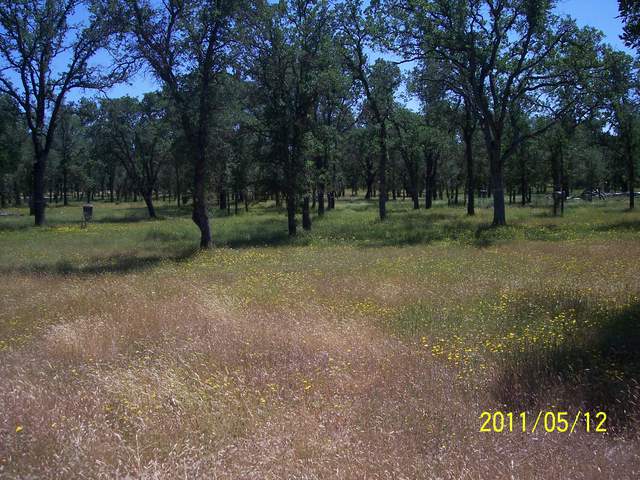
Grass turning brown and flowers in the oak woodland
TZ_drought_patch.jpg ( 2011-05-27 12:44:31 ) Full size: 1496x1122
Grass turning brown and flowers in the oak woodland
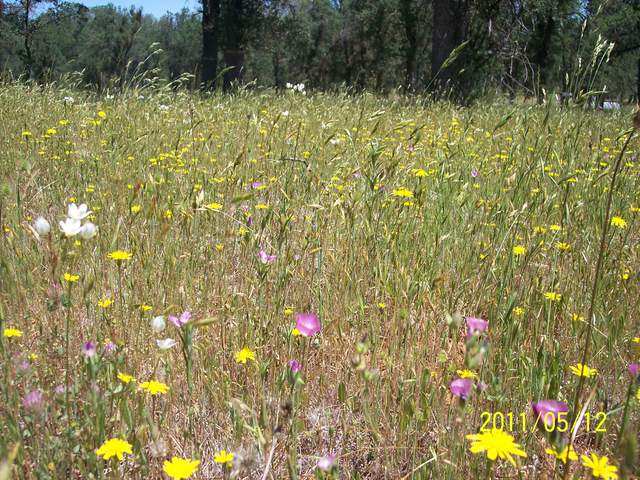
Yellow, white and pink wild flowers
TZ_native_sp8.jpg ( 2011-05-27 11:06:09 ) Full size: 1496x1122
Yellow, white and pink wild flowers

Graphs display:
16 sets found

No data found for TZ_Fenergy.
11 TZ_tmet graphs found

Explore the graph:Tonzi Tower Met: Temperature and Power in a new window

Explore the graph:Tonzi Tower Met: Solar Radiation in a new window

Explore the graph:Tonzi Tower Met: IRT Sensors in a new window

Explore the graph:LED Sensor Incoming in a new window

Explore the graph:LED Sensor Outgoing in a new window

Explore the graph:4-Band Solar Radiation in a new window

Explore the graph:Air Temperature Profile in a new window

Explore the graph:Relativity Humidity Profile in a new window

Explore the graph:Tonzi Tower PRI in a new window

Explore the graph:SRS PRI/NDVI in a new window

Explore the graph:SRS NDVI in a new window

11 TZ_soilco2 graphs found

Explore the graph:Tonzi Soil CO2 Profile: Open (East) CO2 in a new window

Explore the graph:Tonzi Soil CO2 Profile: Tree (West) CO2 in a new window

Explore the graph:Tonzi Soil CO2 Profile: Open (East) Temperatures in a new window

Explore the graph:Tonzi Soil CO2 Profile: Tree (West) Temperatures in a new window

Explore the graph:Tonzi Soil CO2 Profile: Upper CO2 in a new window

Explore the graph:Tonzi Soil CO2 Profile: Lower CO2 in a new window

Explore the graph:Tonzi Soil CO2 Profile: Upper Temperatures in a new window

Explore the graph:Tonzi Soil CO2 Profile: Lower Temperatures in a new window

Explore the graph:Tonzi Soil CO2 Profile: Power and Temperature in a new window

Explore the graph:Tree 2 Soil CO2 in a new window

Explore the graph:Tree 2 Soil Temperature in a new window

Can't check TZ_mixed
3 TZ_mixed graphs found

Explore the graph:Tonzi PPT in a new window

Explore the graph:Tonzi CO2 and H2O Densities in a new window

Explore the graph:Air Pressure in a new window

1 TZ_fflux graphs found

Explore the graph:Tonzi Wind Speed in a new window

8 TZ_fmet graphs found

Explore the graph:Soil Heat Flux in a new window

Explore the graph:Tonzi Soil Temperature Set A in a new window

Explore the graph:Tonzi Soil Temperatures Set B in a new window

Explore the graph:Tonzi Soil Temperatures Set C in a new window

Explore the graph:Tonzi Soil Temperature Set D in a new window

Explore the graph:Well Level in a new window

Explore the graph:Well Water Temperature in a new window

Explore the graph:Soil Water Potential in a new window

1 TZ_tram graphs found

Explore the graph:Tonzi Tram Incoming PAR in a new window

3 TZ_co2prof graphs found

Explore the graph:Tower CO2 Profile Concentrations in a new window

Explore the graph:Tower CO2 Profile Cell Pressure in a new window

Explore the graph:CO2 Profile Sensor Temperature in a new window

No data found for TZ_irt.
No data found for TZ_windprof.
No data found for TZ_tflux.
2 TZ_sm graphs found

Explore the graph:Floor Solar Radiations in a new window

Explore the graph:TZ Soil Moisture in a new window

Can't check TZ_met
1 TZ_met graphs found

Explore the graph:Floor and Tower RH in a new window

Can't check TZVR_mixed
No data found for TZ_osu.
No data found for TZ_fd.
Tonzi Z-cam data

plot of Tonzi z-cam LAI

plot of Tonzi z-cam gap fration