Field Notes
<--2009-01-14 10:00:00 |
2009-02-10 09:30:00-->
Phenocam link:
Searching...Tonzi: 2009-01-19 10:30:00 (DOY 19)
Author: Siyan Ma
Others: Joe
When: Date: 1/19/2009 , Day: 19
, Watch Time: 10:30am .
Where: Tonzi/Vaira Ranch
Who: Siyan, Joe
Weather:
partially clear
Phenology:
green grass, one leaf yellow maybe due to the dry condition, grass density at
Tonzi = (274+186+164)/3/400cm2
Summary
- Always bring an extra set of
Li-7500, in case something goes wrong.
- swap Li-7500 on Vaira,
- check and download data at
Tower, Floor (Tz2_221, ALL_212), and Vaira (Met, D229-244)
- correct PC and datalogger
time with GPS at tower and floor sites.
- grass sample for LAI and
phenology in Tower and Vaira, oak branches for N
- (soil moisture) machine sent
back to company for calibration
- dendrometer
- spectrometer
- oak woody and grass samples
in Tonzi (Alex). No litter sample anymore according to Alexander’s notice.
(sampling frequency: once a month).
Labeling starts from MIBA-US-03-193. (Oct.)
Vaira_Grass
Site
- Fence and gate power: 12
v.
- Panel and Batteries: 13.2 v; 10
amps; 2.9 amps.
- Reading from Gillsonic screen
before downloading data. (The value
of H2O and CO2 should be in the range of 0 – 5 v.)
Time
|
|
Path/File name
|
D:\Data\V09_ 019 .flx
D:\Data\VR09 .raw
|
|
mean
|
std
|
|
mean
|
std
|
w
|
0.1
|
0.279
|
Ts
|
20.318
|
0.575
|
u
|
0.74
|
0.439
|
H2O
|
1.947
|
0.074
|
v
|
1.42
|
0.417
|
CO2
|
1.982
|
0.003
|
- no TC installed.
- downloading data YES!
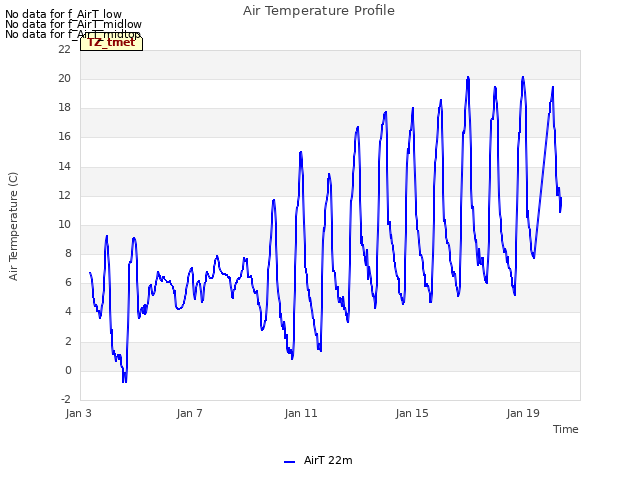
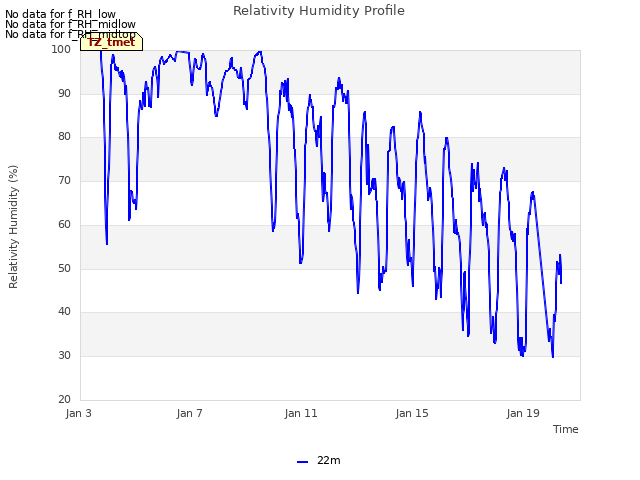
- check the fans of air temp.
and relative humidity sensors at Vaira. YES!
- Check MD-9 system connections YES!
- Check CR23X with two
multiplexers
Sys_vot = 13.24
PC_start =
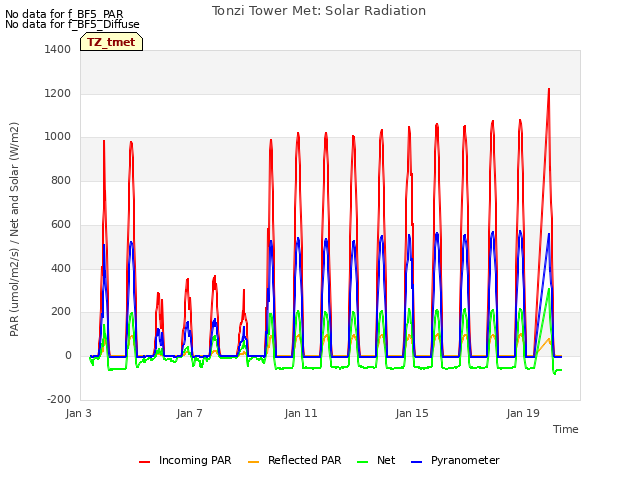
- Check levels of Radiation
sensors, clear up surfaces. YES!
9. Closed gate and
set up fence. YES!
Tonzi_Tower Site
- Fence and gate power: OK
v.
- Panel and Batteries: v; amps; amps.OK
- Reading from Gillsonic screen
before downloading data. (The value
of H2O and CO2 should be in the range of 0 – 5 v.)
Time
|
OK
|
Path/File name
|
D:\Data\T06_
.flx
D:\Data\TW06 .raw
|
|
mean
|
std
|
|
mean
|
std
|
w
|
|
|
Ts
|
|
|
u
|
|
|
H2O
|
|
|
v
|
|
|
CO2
|
|
|
- downloading data YES!
- swaping Li-7500 Analyzer. (Remove SN# 418 ; install SN# 73 )
swapped IRGA because the H2O and CO2 channels looked spiky.
- check the fans of air temp.
and relative humidity sensors on the tower and the floor.
- Check calibration cylinders;
CO 2 500 psig; flow 20
psi.
N 2 1500
psig; flow 20 psi.
Manually calibrate Li-800. Following Ted’s instruction: H:\IoneSavanna_2004\Tower_2004\CO2Profile\LI800_Calibration_Procedure_2Nov04.txt
Is the pump running Dead when we got there. Joe swapped another one, and then it worked
well. Li-800 was calibrated it manually
in the field.
- close gate and set up fence. YES!
Toniz_Floor
Site
- Fence and gate power: 12
v.
- Panel and Batteries: 13.6 v; 18.7 amps; 1.8 amps.
- Reading from Gillsonic screen
before downloading data. (The value
of H2O and CO2 should be in the range of 0 – 5 v.)
Time
|
|
Path/File name
|
D:\Data\F09_ 019 .flx
D:\Data\FL09 .raw
|
|
mean
|
std
|
|
mean
|
std
|
w
|
-0.31
|
0.254
|
Ts
|
16.8
|
0.294
|
u
|
-0.52
|
0.38
|
H2O
|
1.5
|
0.0511
|
v
|
0.49
|
0.298
|
CO2
|
2.1
|
0.009
|
- downloading data YES!
- Check MD-9 system connections
YES!
CR23X3 – floor-Met
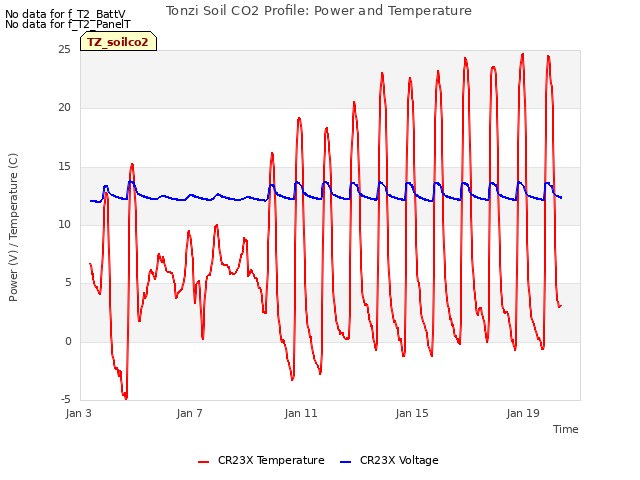
CR23X5 – soil CO 2
profile
CR23X6 – tower-Met – No data
recorded since Day 331, 7:30am, 2008.
Seems the datalogger was dead for no reason. Joe swapped another 23X datalooger and it
worked well.
CR10X2 – floor-Met
CR10X4 – sap-flow
CR10X7 – CO 2 profile
CR10X8 – wind profile
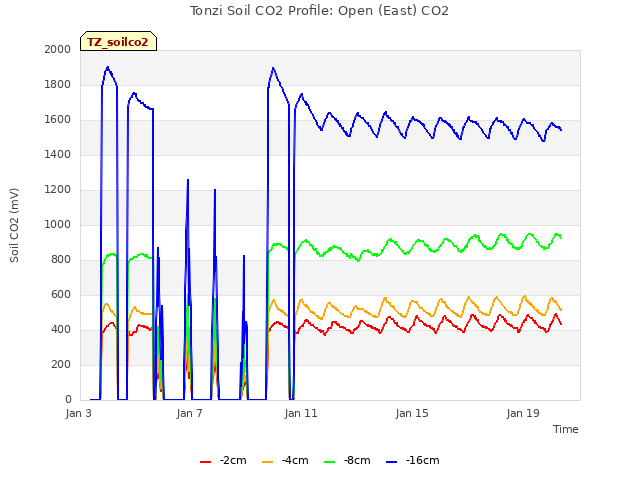
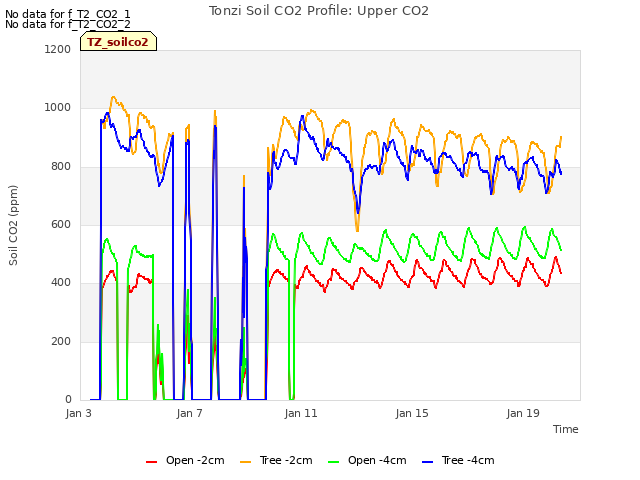
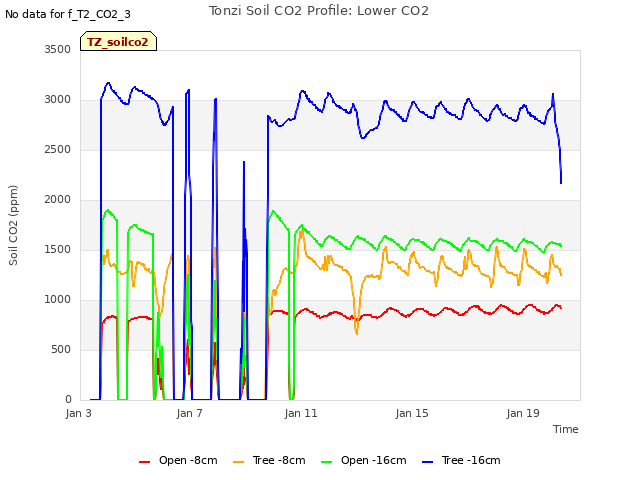
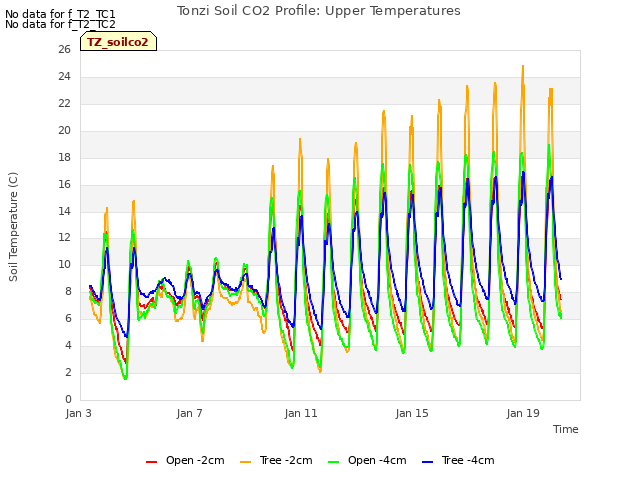
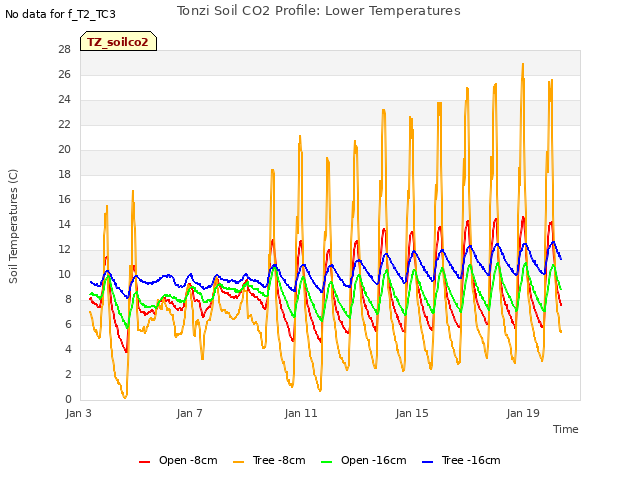
- Soil CO2 profile
OK!
Reading
from datalogger
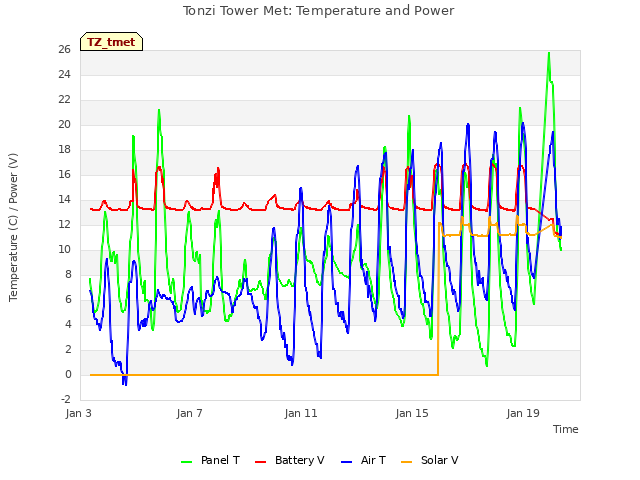
Panel
temp
|
24
|
|
|
Battery
voltage
|
13.5
|
|
|
CO2E_1
|
387
|
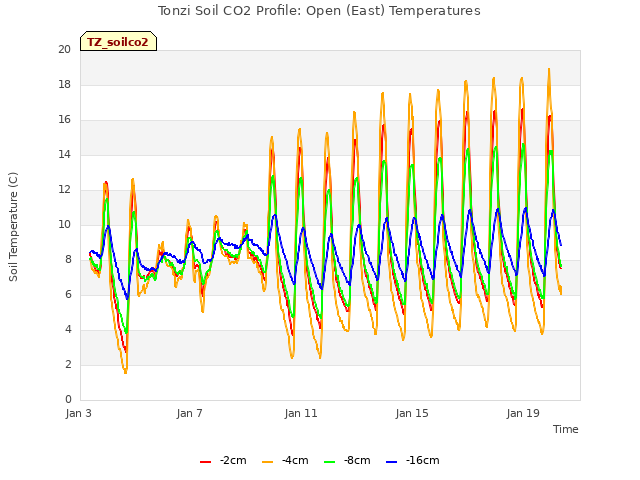
TCE_1
|
13.8
|
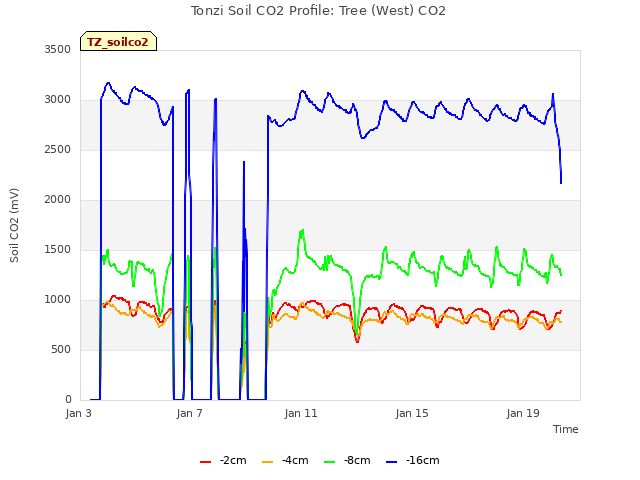
CO2W_1
|
743
|
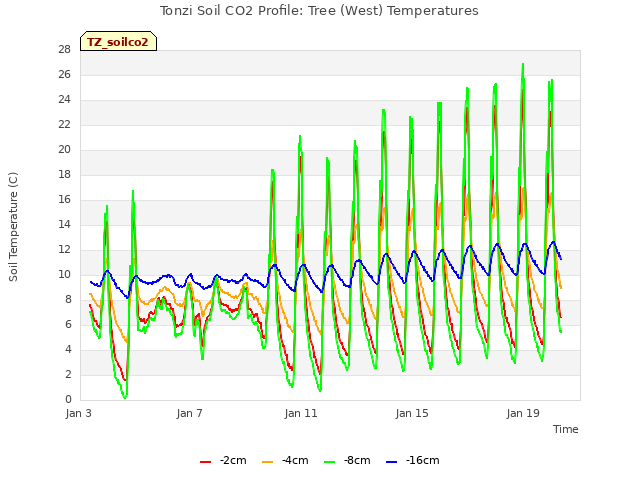
TCW_1
|
15.4
|
CO2E_2
|
521
|
TCE_2
|
12.1
|
CO2W_2
|
712
|
TCW_2
|
14.8
|
CO2E_3
|
867
|
TCE_3
|
12.1
|
CO2W_3
|
1172
|
TCW_3
|
18.4
|
CO2E_4
|
774
|
TCE_4
|
8.8
|
CO2W_4
|
1447
|
TCW_4
|
11.5
|
Reading
from panels of analyzers
depth
|
Open
|
order
|
depth
|
Tree
|
order
|
2cm
(1%)
|
|
1
|
2cm
(1%)
|
|
1
|
4cm
|
|
2
|
4cm
|
|
4
|
8cm
|
|
3
|
8cm
|
|
2
|
16cm
|
|
4
|
16cm
|
|
3
|
- Close gate and set up fence.
Tonzi
|
|
|
|
Dendrometer
|
|
|
|
|
|
|
Date
|
Day
|
Tag #
|
Reading (cm)
|
1/19/2009
|
19
|
71
|
22.7
|
|
|
72
|
23.3
|
|
|
77
|
Broken
|
|
|
78
|
Broken
|
|
|
79
|
22.9
|
|
|
245
|
20.3
|
|
|
248
|
24.2
|
|
|
250
|
21.7
|
|
|
255
|
22.9
|
|
|
252
|
missing
|
|
|
102
|
Broken
|
Sample sheet for MIBA
Sample vial
|
What
|
MIBA-US-01.178
|
Leave 1
|
MIBA-US-01. 179
|
Leave 2
|
MIBA-US-01. 180
|
Grass 1
|
MIBA-US-01. 181
|
Grass 2
|
MIBA-US-01. 182
|
Soil in 10 cm
|
MIBA-US-01. 183
|
Stem 1
|
MIBA-US-01. 184
|
Stem 2
|
|
Field Data
No tank data
No TZ Well data found
No TZ Moisture Point data found
No VR Moisture Point data found
No TZ grass heigth found
No VR grass heigth found
No TZ Tree DBH found
No water potential data found
No TZ Grass Biomass data found
No TZ OakLeaves Biomass data found
No TZ PineNeedles Biomass data found
0 photos found
16 sets found
No data found for TZ_Fenergy.
11 TZ_tmet graphs found


11 TZ_soilco2 graphs found


Can't check TZ_mixed
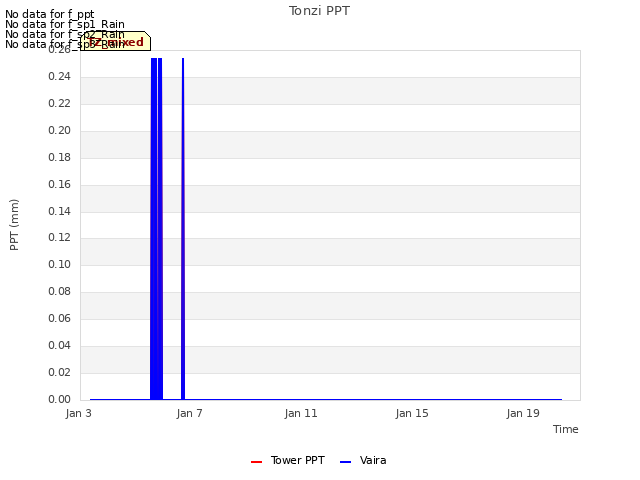
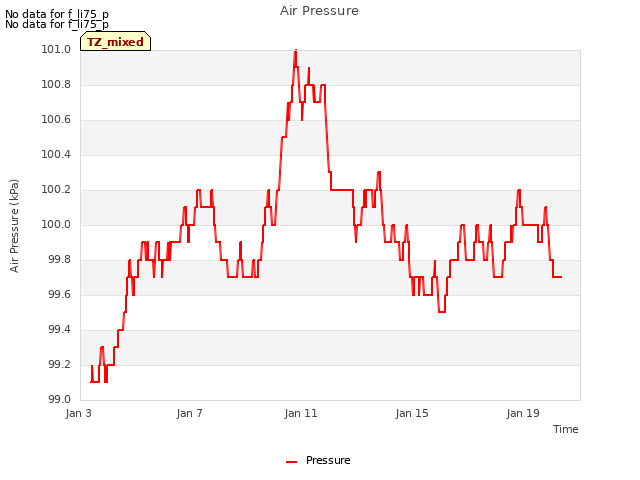
3 TZ_mixed graphs found

No data found for TZ_fflux.
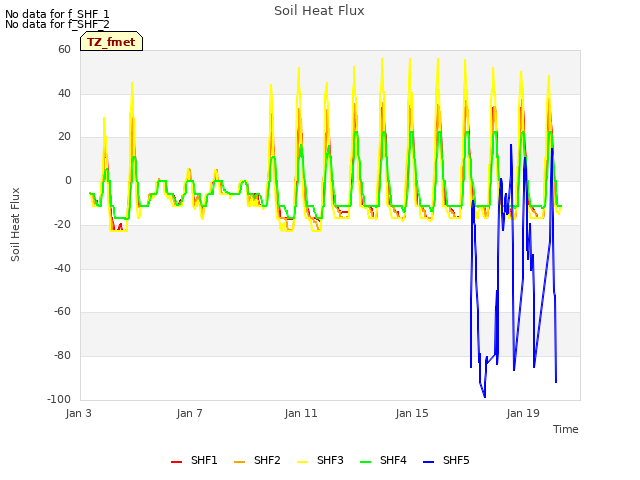
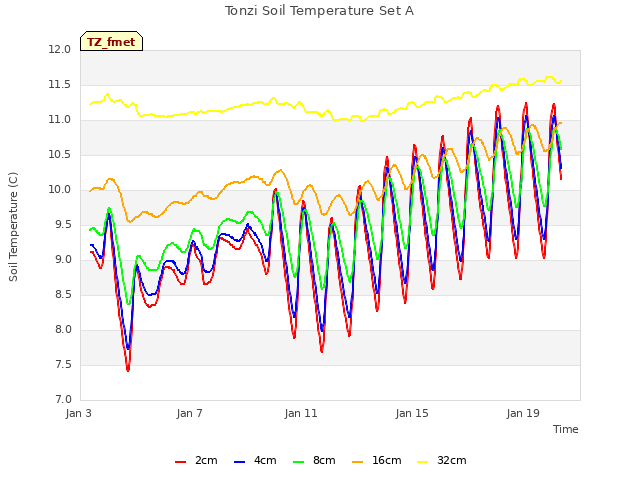
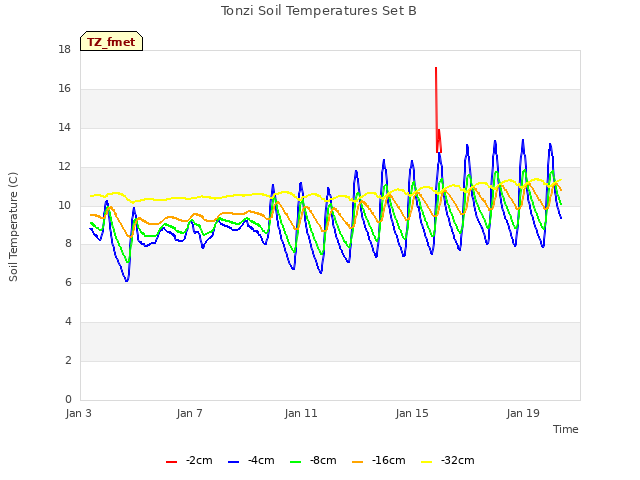
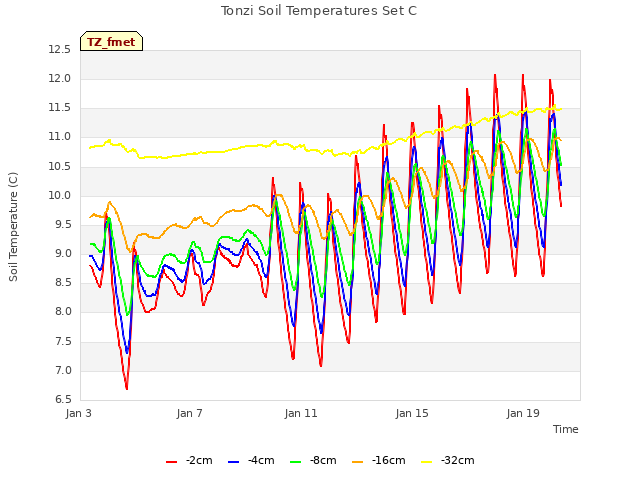
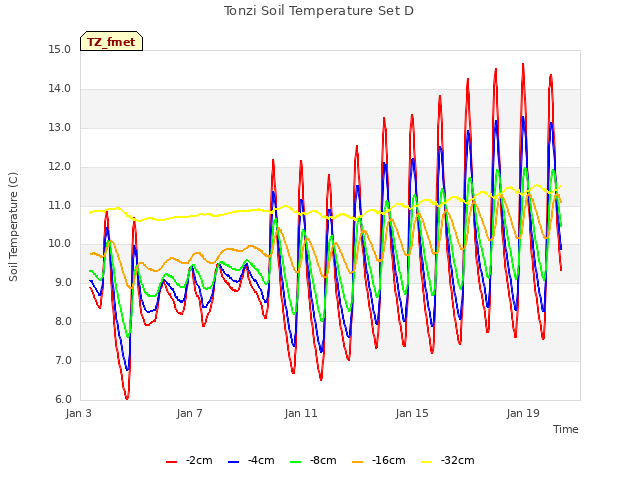
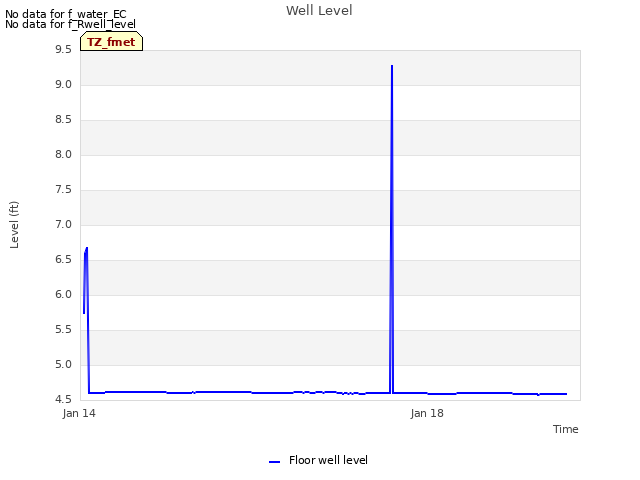
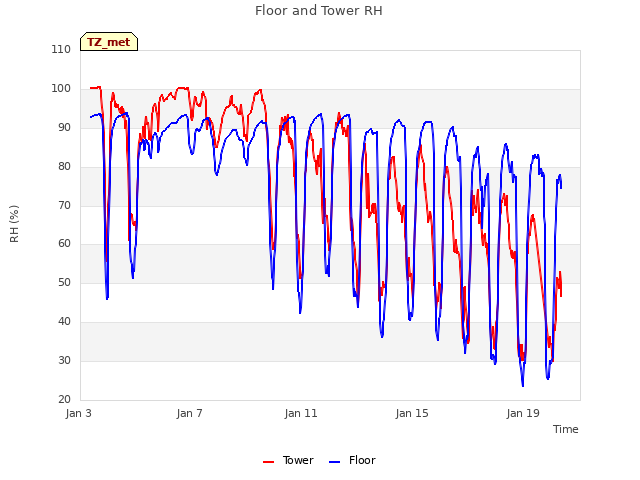
8 TZ_fmet graphs found


No data found for TZ_tram.
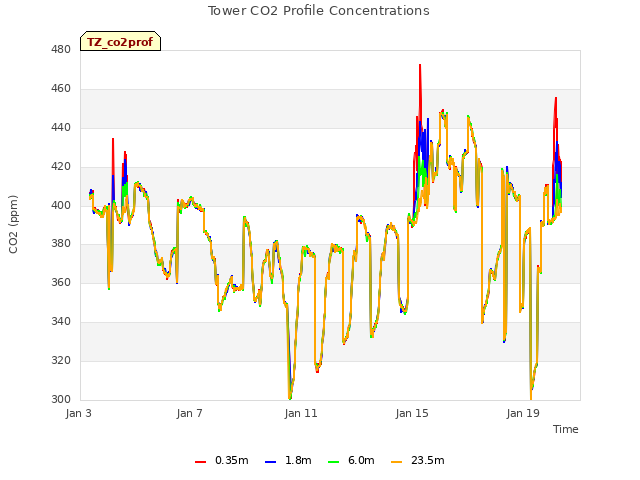
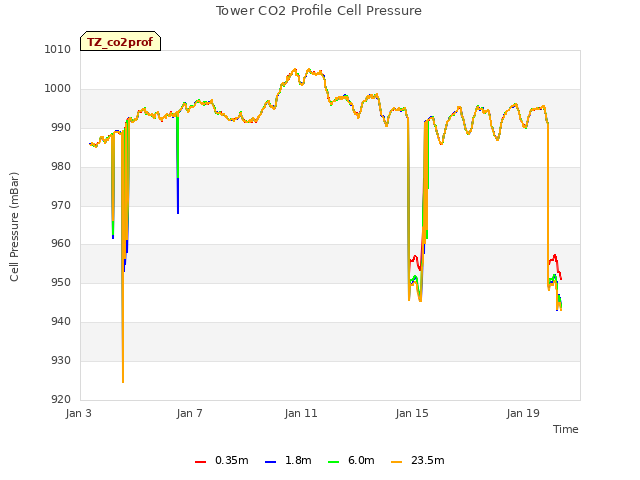
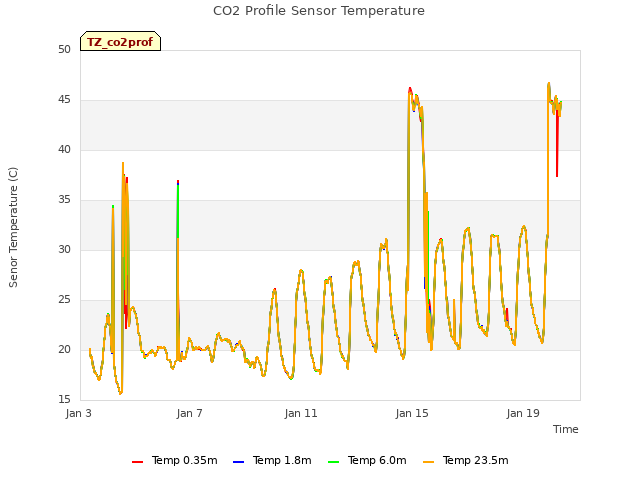
3 TZ_co2prof graphs found
No data found for TZ_irt.
No data found for TZ_windprof.
No data found for TZ_tflux.
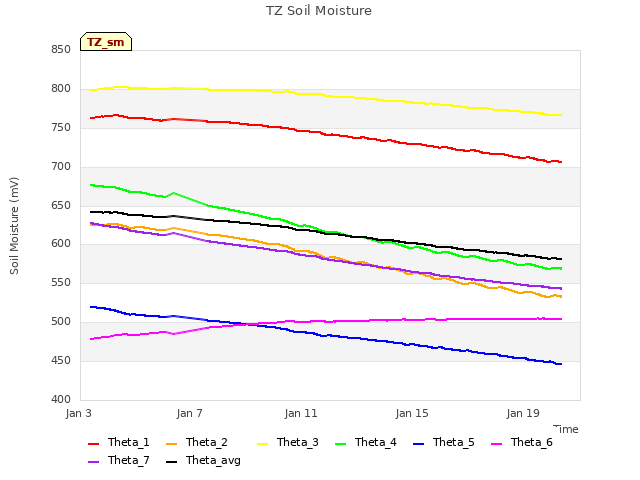
2 TZ_sm graphs found

Can't check TZ_met
1 TZ_met graphs found
Can't check TZVR_mixed
No data found for TZ_osu.
No data found for TZ_fd.
Tonzi Z-cam data


