
Field Notes
<--2025-02-21 10:50:00 | 2025-03-27 08:00:00-->Other sites visited today: Vaira
Phenocam link: Searching...
Tonzi: 2025-03-11 10:45:00 (DOY 70)
Author: Joe Verfaillie
Others: Kuno
Summary: Standard data collection, Kuno added twig flux, Installed FD from Vaira at tree1 and move FD back to open, garter snake, pulled Under moisture point probe.
| Tonzi 2025-03-11 Kuno and I arrived at about 11:45 PDT - first visit since the return to daylight savings. It was clear, sunny and warm. The trees have started to put on leaves - the mutant next to Tonzi's house is almost fully leafed out. More cold and wet weather is due to start tomorrow though. At the site we met a cowboy on horseback that was out looking for the cows to see if they were well. He said there is about 100 head on the land. Still big puddles on the road by the tower. Rob left some big ruts in the ground to the west of the soil CO2 fence where they were pulling logs out from a downed pine over near trees 72 and 79. I climbed the tower and did the tower top stuff. The wash reservoir was nearly full - I topped it up. I tried to update the phenocam scripts remotely yesterday but had a DNS problem (I think). The 7500 read: 436.4ppm CO2, 305.3mmol/m3 H2O, 16.0C, 98.3kPa, 100.2SS The 770o read: 2.08ppm CH4, 62.3RSSI - 86.4 after cleaning I cleaned the radiometers. At the Floor Kuno did his usual rounds of trunk and soil fluxes. This time he added some twig ends and clipped them hoping to get surface area. The wash reservoir here was nearly full too and topped off. I collected the well and three tree bole temps. The 7500 read: 431.9ppm CO2, 304.5mmol/m3 H2O, 18.4C, 98.6kPa, 103.1SS The 7700 read: 2.07ppm CH4, 61.5RSSI - 76.2 after cleaning I should bring some nail polish to touch up the 7700 spars. The optics RH has been stable at 12%. I did the manual moisture point readings. I pulled the Under probe sn 000000402165 because it has crushed and broken pins. I read the manual dendrometers - one might have been pulled on by cows. I collected the FD data. Last time I moved the open FD sn FD20190027 to the tree1 location because that FD died. This time I put it back in the open location and swapped in the FD from Vaira sn FD20180026 under the tree. Found a large (3ft) northwestern garter snake near the Floor site. I serviced the zcams, measured the wells and collected the Road Well data. The cows had messed up the fence around the Tower again. I straightened it out and added another fence post in the southeast corner. I also braced both of the southern corners with diagonal posts. I found another old litter basket in that area and pulled it out. I also brought a dead battery in from west of the Soil CO2 fence - there are still a couple of broken boardwalks over there. The Floor met box door was ajar when we got there I closed and fastened it. We left at about 15:30 PDT |
Field Data
No tank data
Well Depth
| Date | Location | Depth (feet) |
|---|---|---|
| 2025-03-11 | VR_well | 54.4 |
| 2025-03-11 | TZ_floor | 26 |
| 2025-03-11 | TZ_road | 34.15 |
| 2025-03-11 | TZ_tower | 29.6 |
No TZ Moisture Point data found
No VR Moisture Point data found
No TZ grass heigth found
No VR grass heigth found
Tree DBH
| Date | Tag# | Reading (mm) |
|---|---|---|
| 2025-03-11 | 1 | 14.1 |
| 2025-03-11 | 102 | 7.9 |
| 2025-03-11 | 2 | 18.0 |
| 2025-03-11 | 245 | 13.0 |
| 2025-03-11 | 3 | 11.4 |
| 2025-03-11 | 4 | 9.1 |
| 2025-03-11 | 5 | 6.4 |
| 2025-03-11 | 6 | 10.1 |
| 2025-03-11 | 7 | 17.6 |
| 2025-03-11 | 72 | 4.3 |
| 2025-03-11 | 79 | 11.7 |
No water potential data found
No TZ Grass Biomass data found
No TZ OakLeaves Biomass data found
No TZ PineNeedles Biomass data found
3 photos found
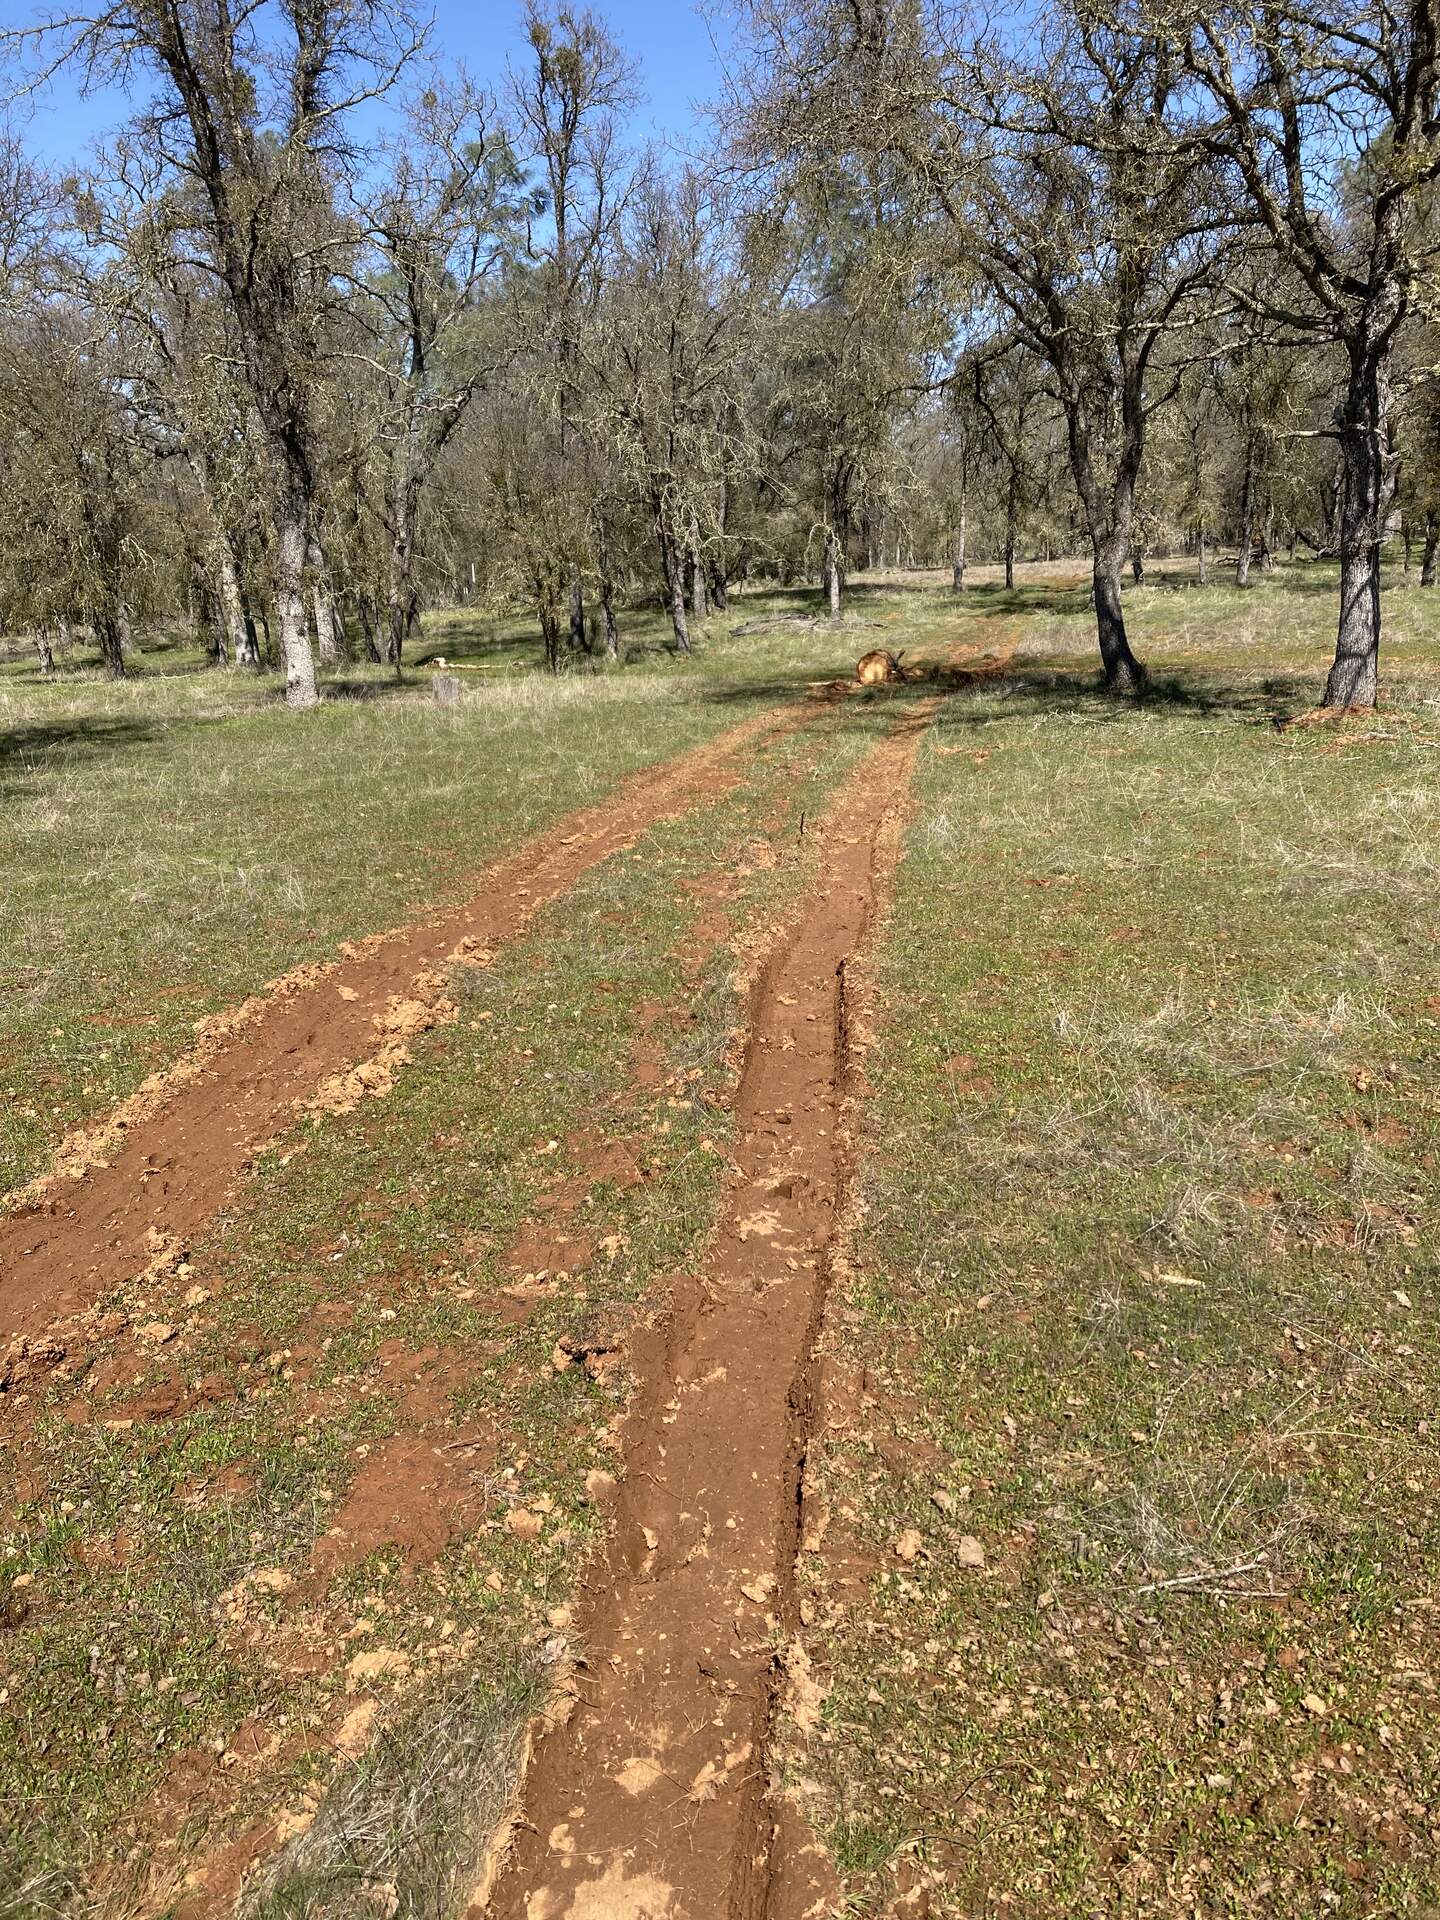
20250311TZ_LoggingRuts.jpg ( 2025-03-11 13:13:30 ) Full size: 1440x1920
Ruts left by Rob pulling pine logs out
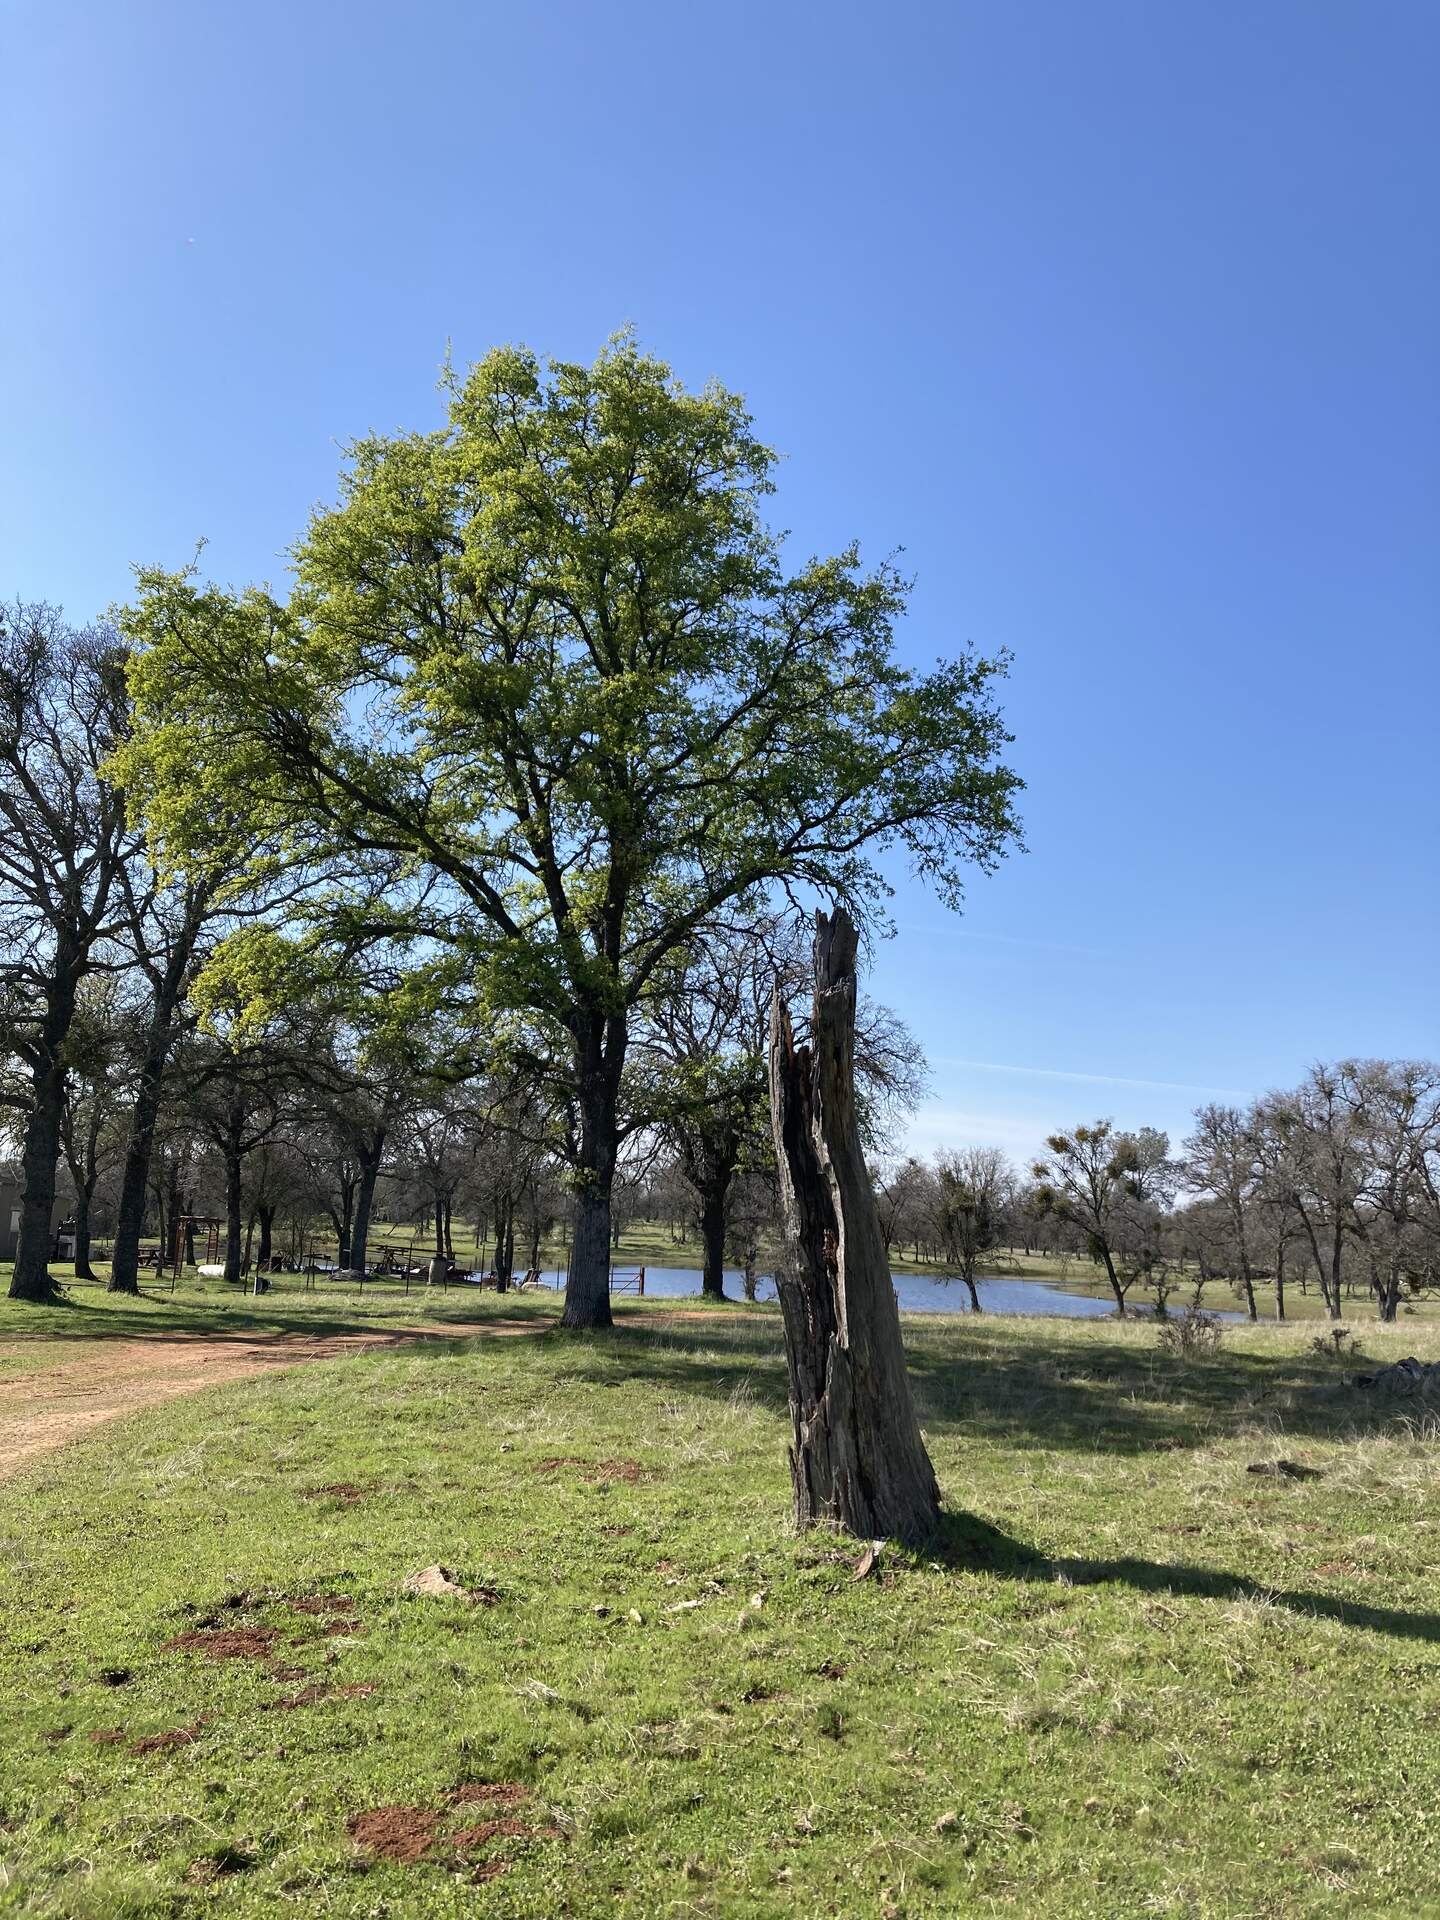
20250311TZ_MutantTreeLeaves.jpg ( 2025-03-11 15:27:37 ) Full size: 1440x1920
Oak tree near Tonzi house has leaves early
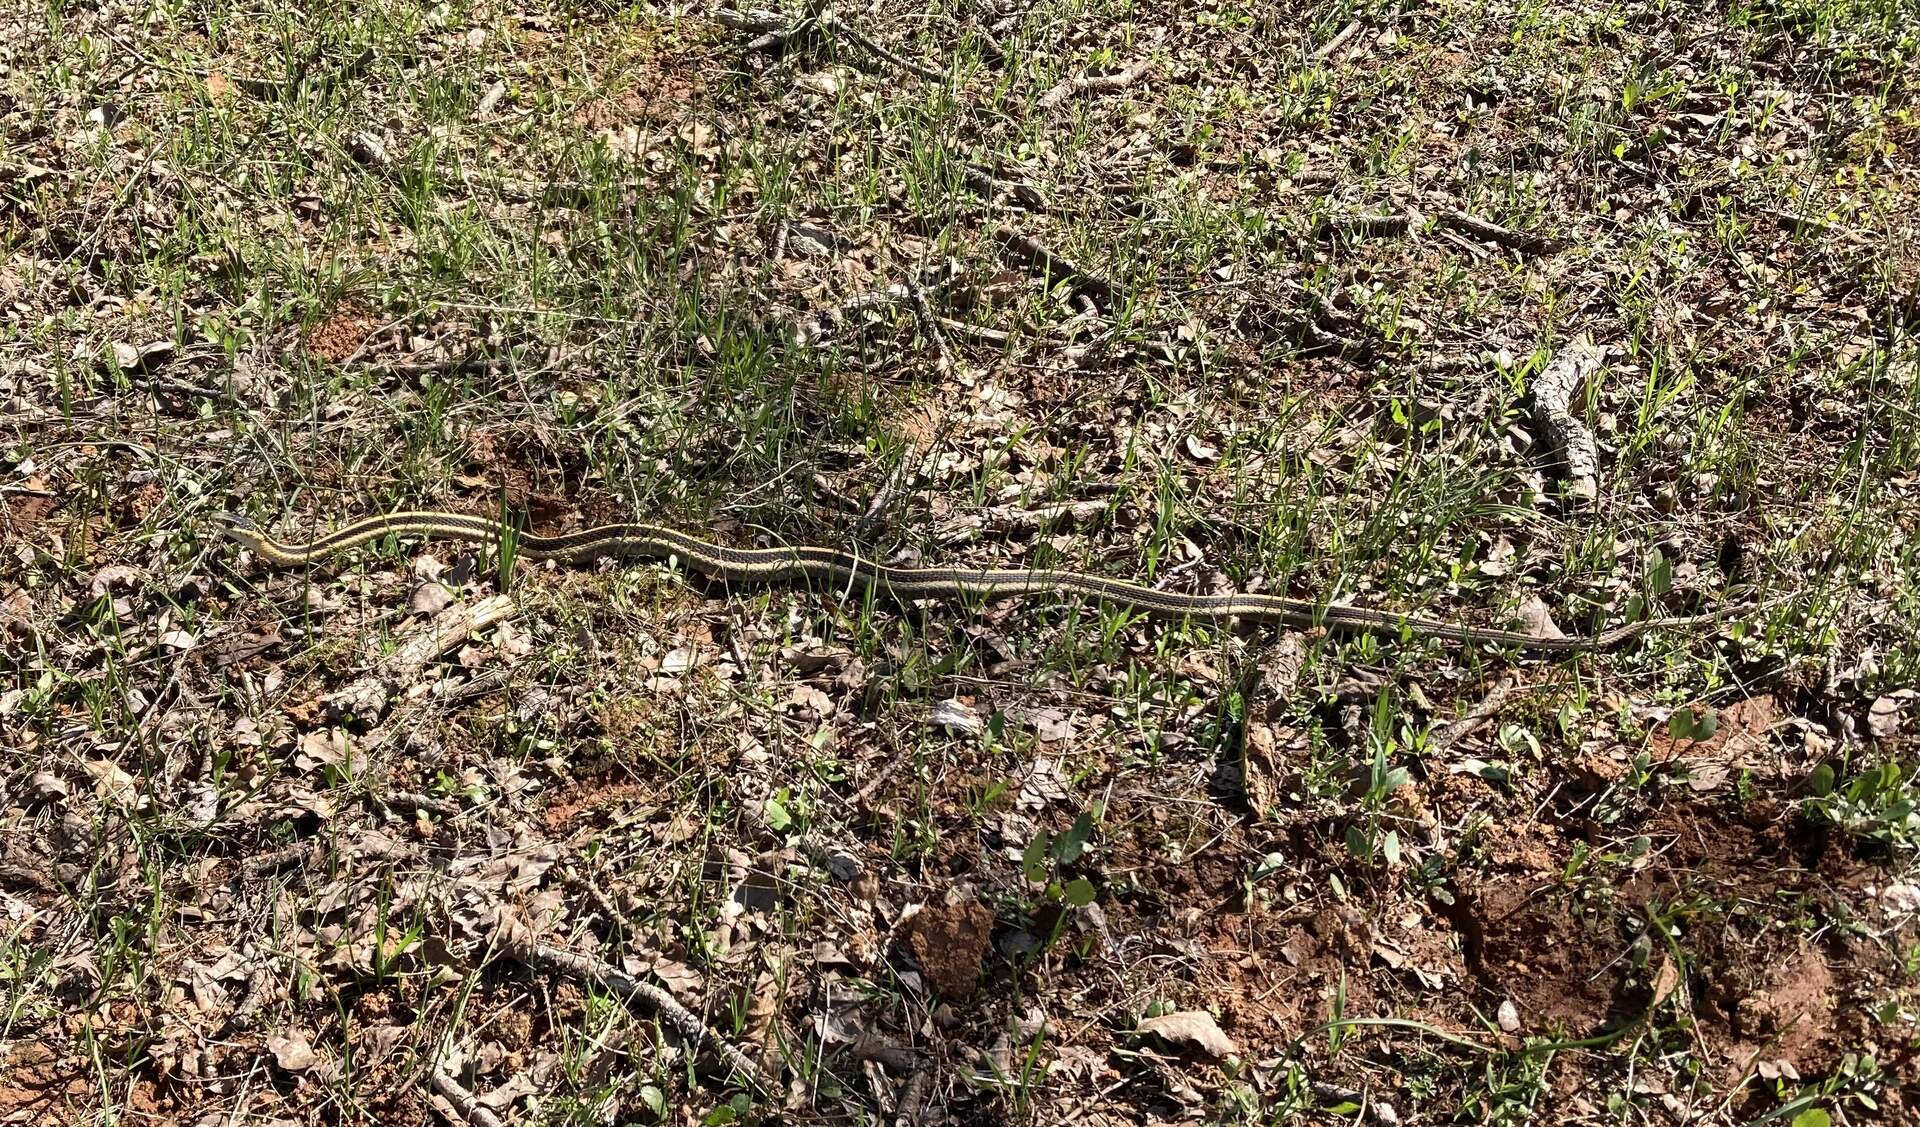
20250311TZ_NorthwesternGarterSnake.jpg ( 2025-03-11 13:37:16 ) Full size: 1920x1127
Northwestern garter snake
16 sets found
No data found for TZ_Fenergy.
11 TZ_tmet graphs found
No data found for TZ_soilco2.
Can't check TZ_mixed
3 TZ_mixed graphs found
1 TZ_fflux graphs found
8 TZ_fmet graphs found
No data found for TZ_tram.
3 TZ_co2prof graphs found
1 TZ_irt graphs found
No data found for TZ_windprof.
1 TZ_tflux graphs found
8 TZ_sm graphs found
Can't check TZ_met
1 TZ_met graphs found
Can't check TZVR_mixed
8 TZ_osu graphs found
3 TZ_fd graphs found
Tonzi Z-cam data