
Field Notes
<--2025-02-07 11:10:00 | 2025-03-11 10:45:00-->Other sites visited today: Vaira
Phenocam link: Searching...
Tonzi: 2025-02-21 10:50:00 (DOY 52)
Author: Joe Verfaillie
Others: Kuno
Summary: Phenocam images went missing, Replaced North T3 TC on tree stem temps, Removed Tree1 FD due to bad CO2 reading replaced with open FD, IRT tilted, zcam1 tilted, Tower fence fixed.
| Tonzi 2025-02-21 Kuno and I arrived at 10:50 PST. It was clear sunny and mild with a light breeze. The pond has doubled in size since the last visit. There was a little more rain, but I guess the ground is finally saturated and it mostly runs off now. Still I have seen the pond fuller. The grass is green, the trees are still dormant. I collected the tower top flux data, but the phenocam had not written any files. I didn't see a card error, but the green eject light didn't come on when I pushed the button. The Ethernet was working though. I unpowered the CR1000, removed the card/Ethernet interface and found a bit of corrosion on the pins. I scrapped both sides with a screw driver, reseated the interface and made sure the camera files were saved and the Ethernet worked. Maybe need to think harder about connecting the camera to the internet. The wash reservoir was almost full - topped off. The 7500 read: 434.7ppm, 414.4mmol/m3, 15.4C, 99.6kPa, 100.4SS The 7700 read: 2.09ppm, 68.1RSSI - 83.8 after cleaning At the Floor tower Kuno did his usual rounds of stem and soil fluxes - he saw much larger releases of CO2 and CH4 than before. He also added five soil collars inside the Soil CO2 fence. I think he saw CH4 uptake there. The Floor tower seemed to be running fine. I collected the flux, well data, tree stem temps and serviced zcam 3. I swapped TC3 on the north tree stem temp system - the original one was intermittently bad. I unwired the old TC but didn't totally removed it so its ends are hanging loose. The 7500 read: 430.9ppm,444.0mmol/m3, 18.1C, 99.8kPa, 103.0SS The 7700 read: 2.07ppm, 69.5RSSI - 79.8 after cleaning The wash reservoir was nearly full - topped off. The optics RH was 16%. I did the manual soil moisture, well and dendrometer readings. I serviced the other two zcams. Zcam1 had been tilted and its box was cracked. I had to pry the box back in place but the crack closed up pretty well. Maybe some lower gap fraction numbers but trees haven't changed recently - easy to gap fill. The FD chamber under the tree was reading random CO2 values. I removed that chamber sn FD20200001 and moved the open FD chamber sn FD20190027 to the under tree location. The open FD chamber usually matches the two at Vaira pretty well but the under tree one does its own thing. Cows had tilted the ground IRT again - I twisted it back in place. The fence charger on the Tower fence was not working due to rotted leads on the battery. I fixed the leads then Kuno and I untangled fence wires and it seemed to be working well again. On the way out we stopped at the pond to do floating chamber fluxes just for fun. We left at about 14:20 PST |
Field Data
No tank data
Well Depth
| Date | Location | Depth (feet) |
|---|---|---|
| 2025-02-21 | TZ_floor | 27.05 |
| 2025-02-21 | TZ_road | 34.7 |
| 2025-02-21 | TZ_tower | 31 |
| 2025-02-21 | VR_well | 55.4 |
| 2025-02-21 | VR_pond | 22.08 |
No TZ Moisture Point data found
No VR Moisture Point data found
No TZ grass heigth found
No VR grass heigth found
Tree DBH
| Date | Tag# | Reading (mm) |
|---|---|---|
| 2025-02-21 | 1 | 14.7 |
| 2025-02-21 | 102 | 9.3 |
| 2025-02-21 | 2 | 17.9 |
| 2025-02-21 | 245 | 13.5 |
| 2025-02-21 | 3 | 11.4 |
| 2025-02-21 | 4 | 14.1 |
| 2025-02-21 | 5 | 6.3 |
| 2025-02-21 | 6 | 10.3 |
| 2025-02-21 | 7 | 17.6 |
| 2025-02-21 | 72 | 7.3 |
| 2025-02-21 | 79 | 11.9 |
No water potential data found
No TZ Grass Biomass data found
No TZ OakLeaves Biomass data found
No TZ PineNeedles Biomass data found
2 photos found
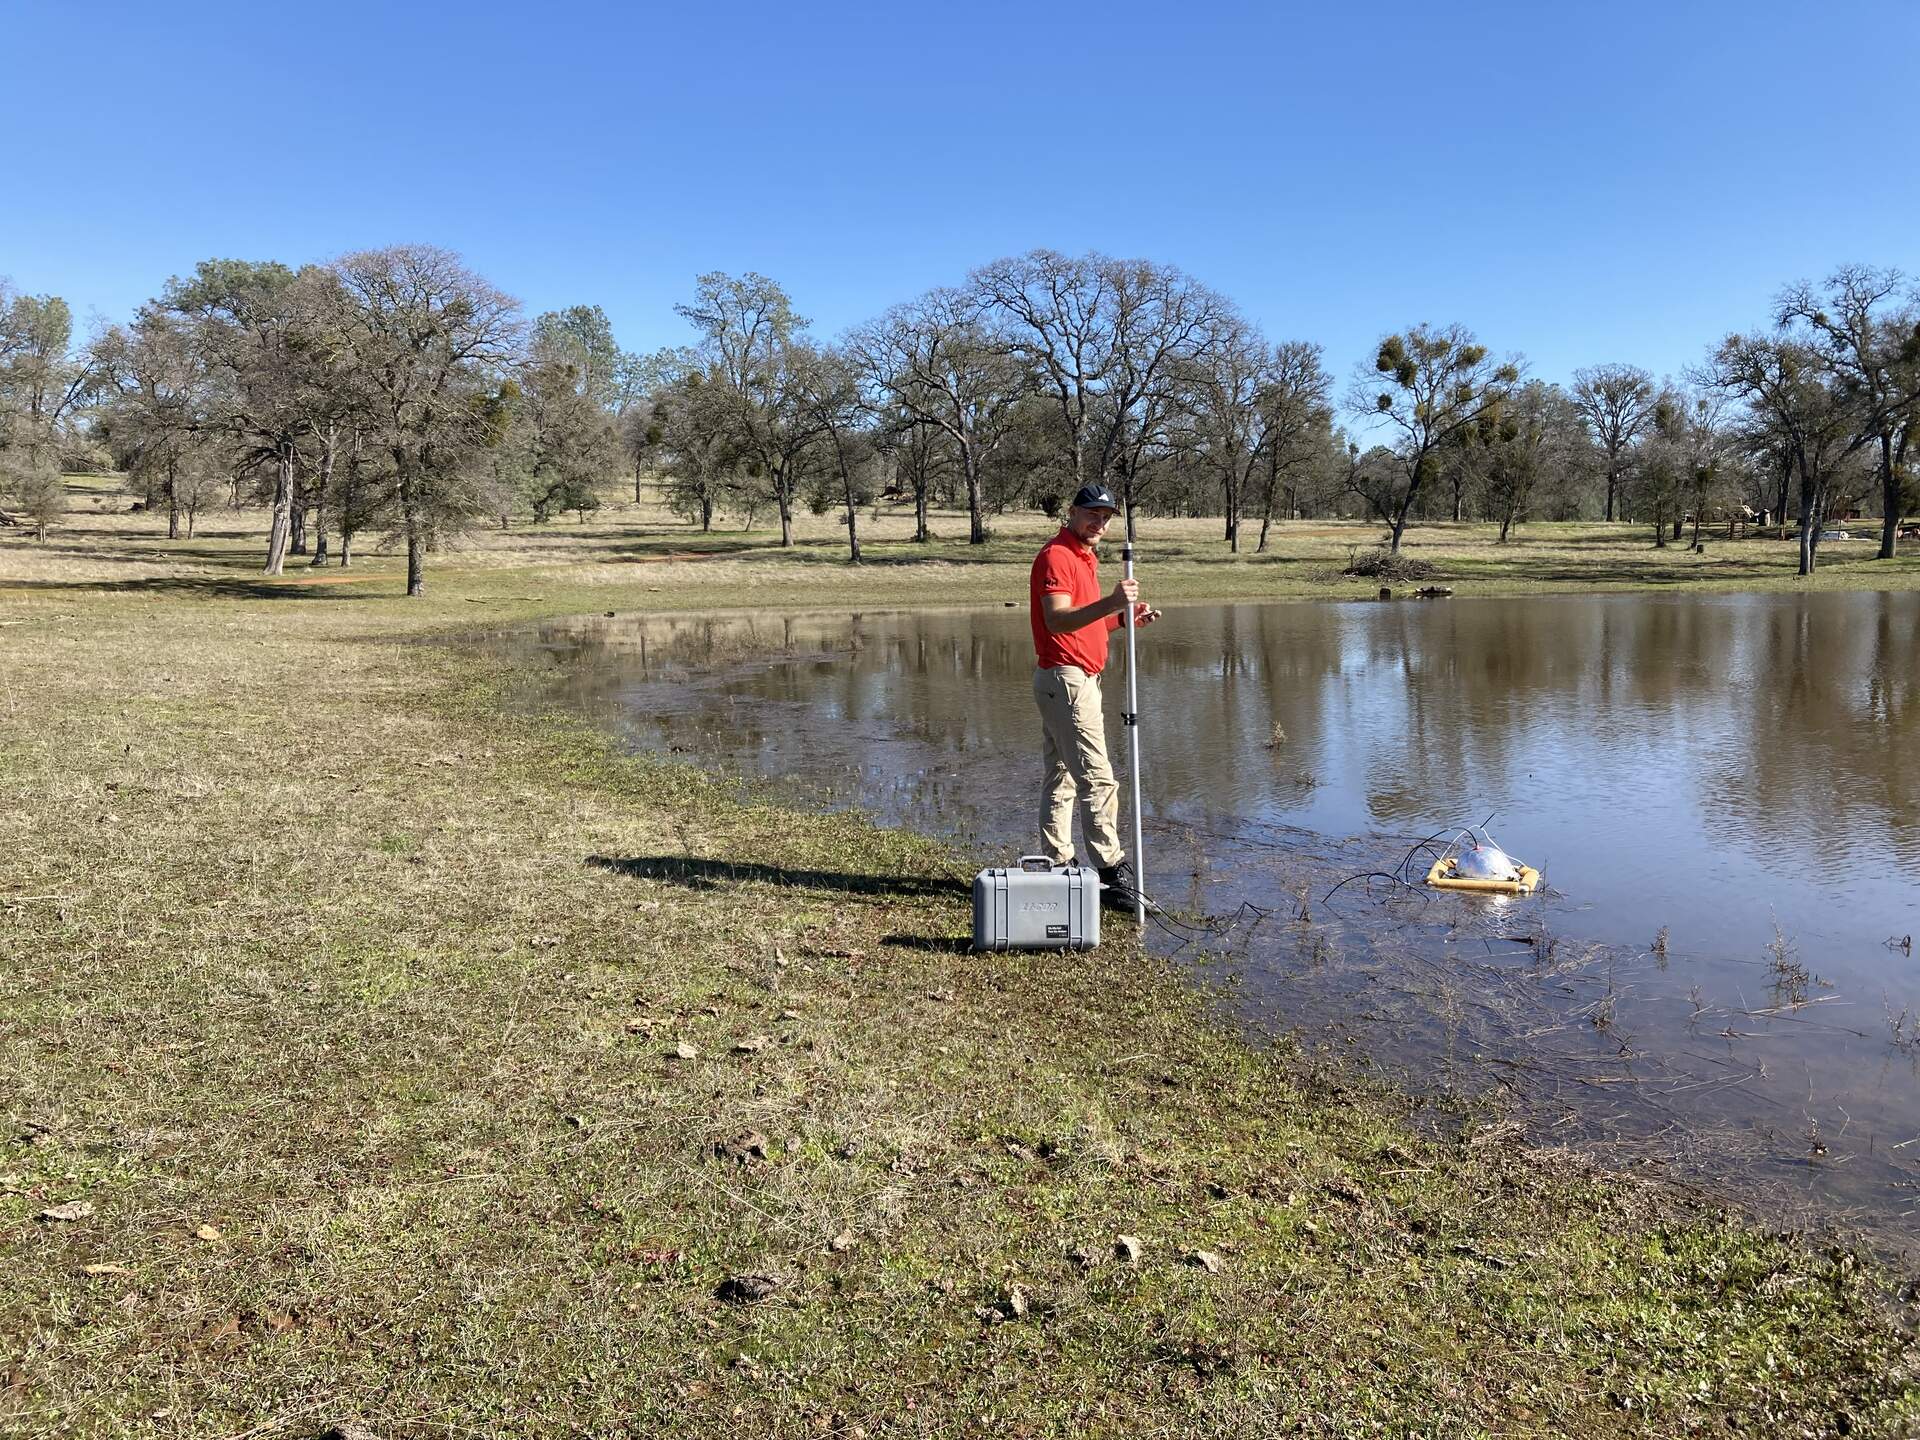
20250221TZ_KunoPond.jpg ( 2025-02-21 14:02:28 ) Full size: 1920x1440
Kuno doing CO2/CH4 floating chamber fluxes on the Tonzi pond
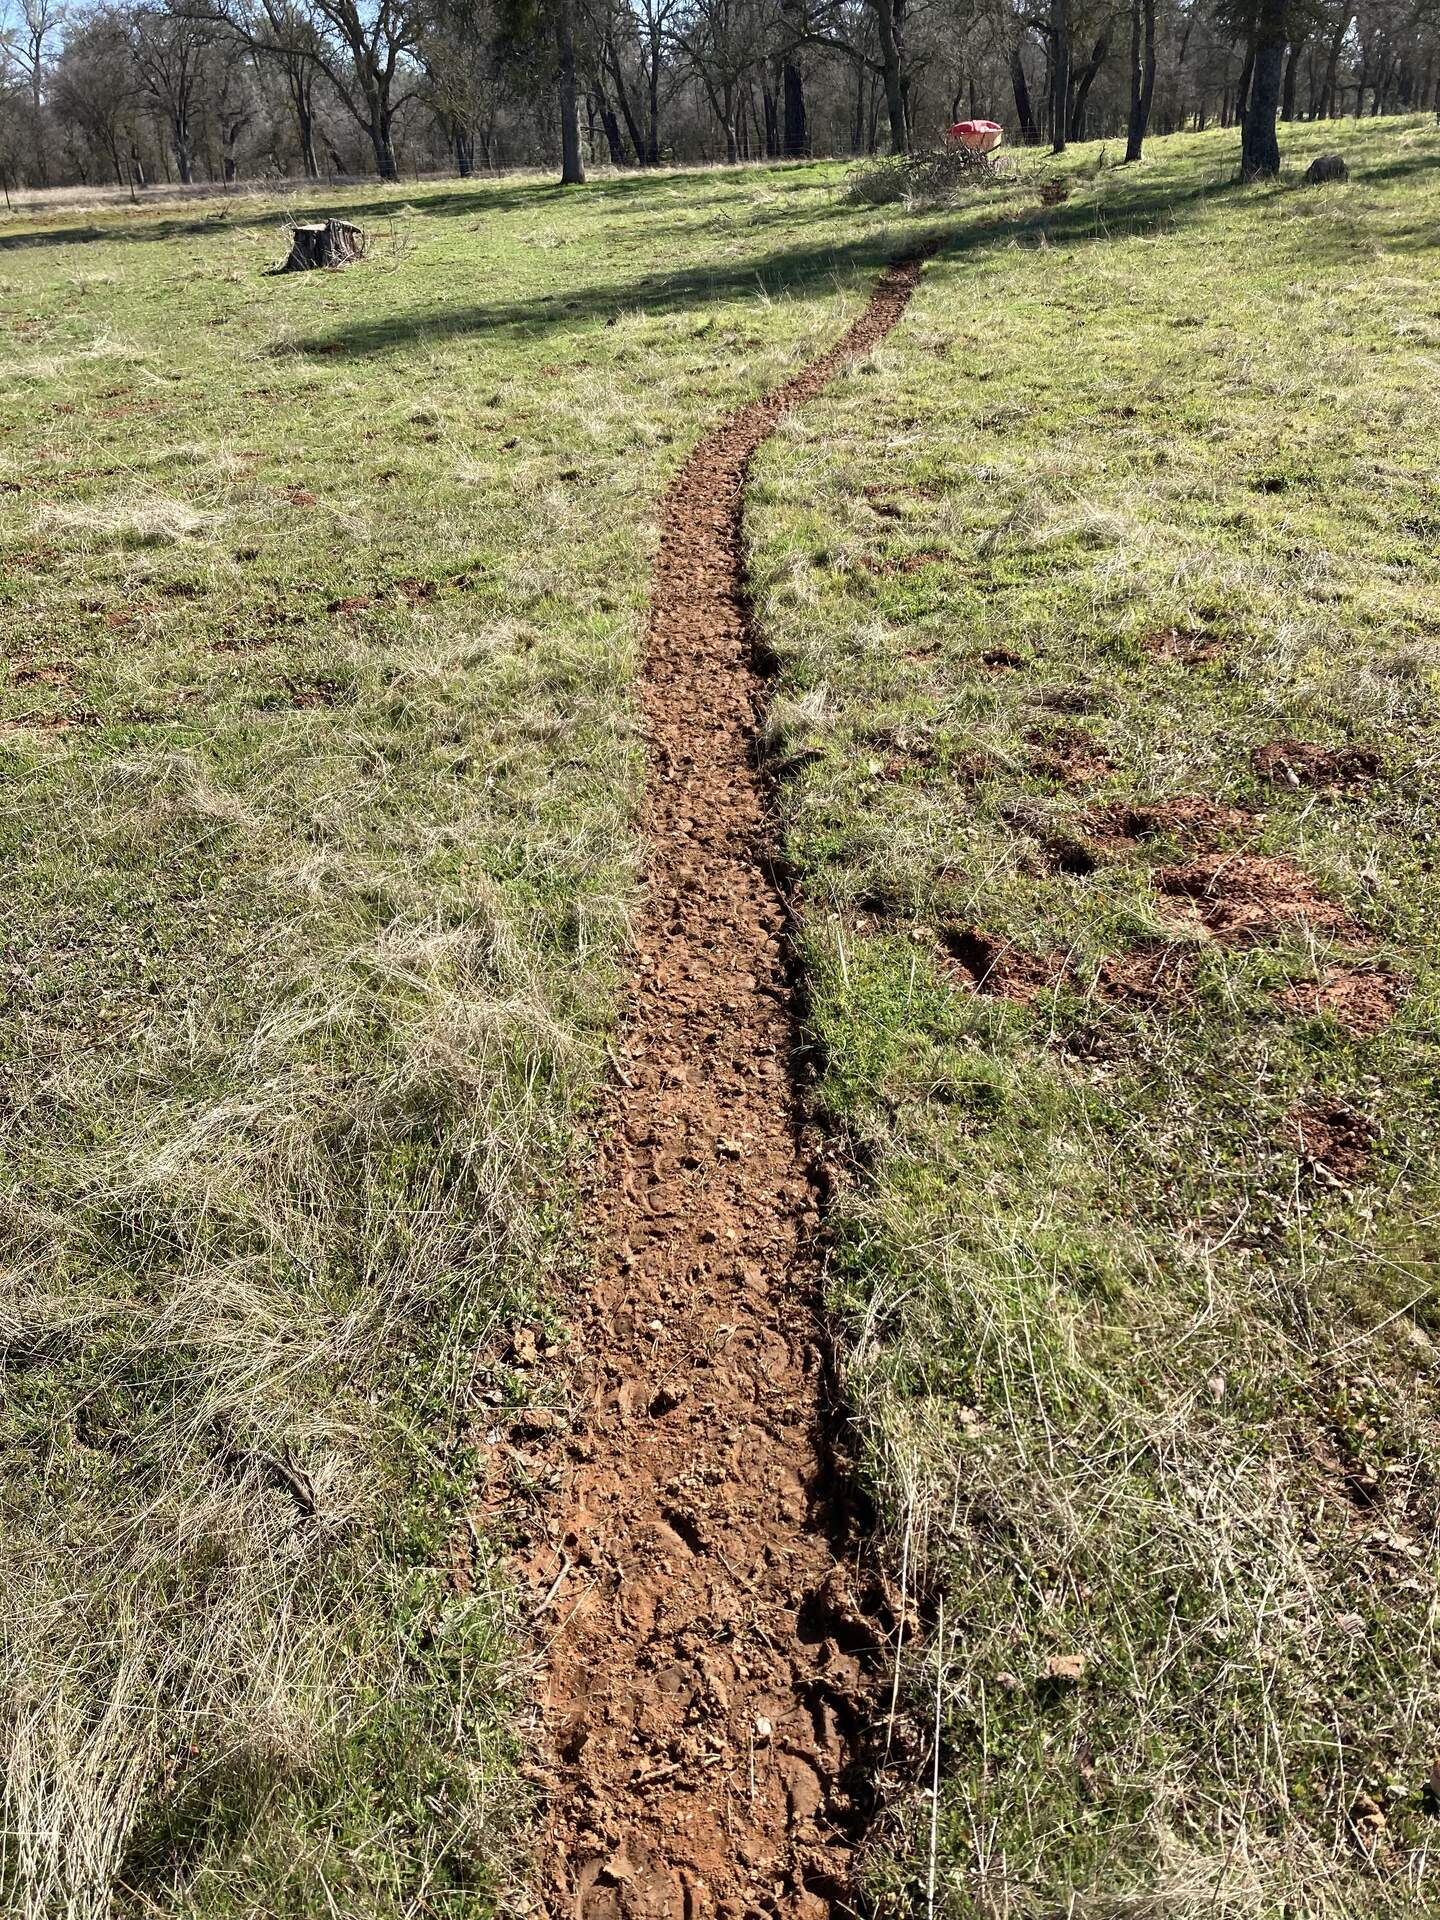
20250221TZ_CowPath.jpg ( 2025-02-21 13:17:32 ) Full size: 1440x1920
Cows make very precise paths through the grass
16 sets found
No data found for TZ_Fenergy.
11 TZ_tmet graphs found
No data found for TZ_soilco2.
Can't check TZ_mixed
3 TZ_mixed graphs found
1 TZ_fflux graphs found
8 TZ_fmet graphs found
No data found for TZ_tram.
3 TZ_co2prof graphs found
1 TZ_irt graphs found
No data found for TZ_windprof.
1 TZ_tflux graphs found
8 TZ_sm graphs found
Can't check TZ_met
1 TZ_met graphs found
Can't check TZVR_mixed
8 TZ_osu graphs found
3 TZ_fd graphs found
Tonzi Z-cam data