Field Notes

<--2024-09-26 08:30:00 | 2024-10-10 08:30:00-->
Phenocam link: Searching...

Gilbert Tract: 2024-10-05 11:15:00 (DOY 279)
Author: Robert Shortt
Others: Kuno

Summary: Chamber measurements during low tide

2024-10-05
Gilbert Tract

Kuno and I arrived at Dutch Slough at 11:15 PST, just at the trough of low tide according to the predictions from Jersey Island. We had already warmed up the analyzer and proceeded to immediately begin measuring. We sampled the same three locations at each temperature profile, and got good, stable slopes from each measurement. We finished sampling around 12:30.

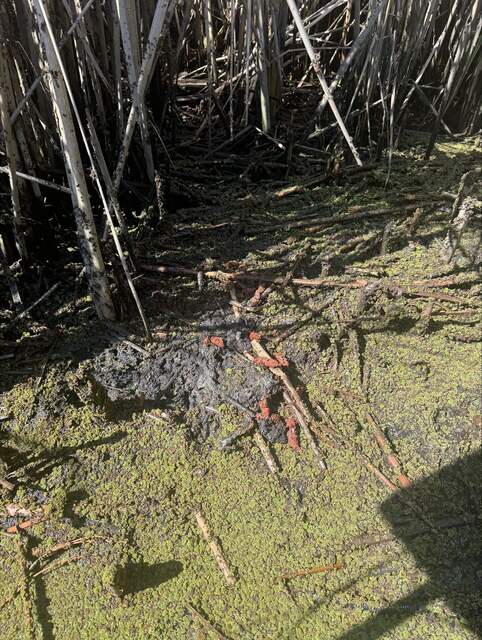
One of the sites had fresh otter poop.

The weather was very warm, which I anticipate may produce anomalously high methane fluxes. It also meant we had to get creative about our attire.

1 photos found

Fresh otter poop at one of the thermocouple profile sites seen during low tide
20241005GT_OtterPoop.jpg ( 2024-10-05 00:00:00 ) Full size: 1446x1920
Fresh otter poop at one of the thermocouple profile sites seen during low tide

Graphs display:
8 sets found

Can't check MBWPEESWGT_mixed
Can't check MBEEWPSWEPGT_cam
16 GT_met graphs found

Explore the graph:Temperatures in a new window

Explore the graph:Temperature Profile A in a new window

Explore the graph:Temperature Profile B in a new window

Explore the graph:Temperature Profile C in a new window

Explore the graph:Soil Heat Flux in a new window

Explore the graph:Four channel Radiometer in a new window

Explore the graph:Gilbert Tract PAR in a new window

Explore the graph:PRI Channels in a new window

Explore the graph:NDVI Channels in a new window

Explore the graph:Water level and Rain in a new window

Explore the graph:Dissolved CO2 in a new window

Explore the graph:Air Pressure in a new window

Explore the graph:Battery Voltage and RH in a new window

Explore the graph:SRS NDVI and PRI in a new window

Explore the graph:Conductivity in a new window

Explore the graph:Dissolved Oxygen in a new window

4 GT_flux graphs found

Explore the graph:CO2 and H2O in a new window

Explore the graph:Wind in a new window

Explore the graph:Methane in a new window

Explore the graph:Data Counts in a new window

3 GT_adcp graphs found

Explore the graph:Water Level in a new window

Explore the graph:Flow Velocities in a new window

Explore the graph:Flow Rate in a new window

1 GT_cam graphs found

Explore the graph:GCC in a new window

2 GT_usgs graphs found

Explore the graph:Jersey Island EC, Turbidity in a new window

Explore the graph:Jersey Island Height, Velocity, Discharge in a new window

2 GT_chanexo graphs found

Explore the graph:EXO pH + ORP in a new window

Explore the graph:EXO Turbidity + fDOM in a new window