Field Notes
<--2024-08-30 13:15:00 | 2024-09-19 08:20:00-->Other sites visited today: Hill Slough
Phenocam link: Searching...
Mayberry: 2024-09-11 12:30:00 (DOY 255)
Author: Daphne Szutu
Others: Joe
Summary: Replaced one of the rusty bottom scaffolding layers, disturbed vegetated-red sipper profile, water level has come up, sheep have trimmed vegetation near our site
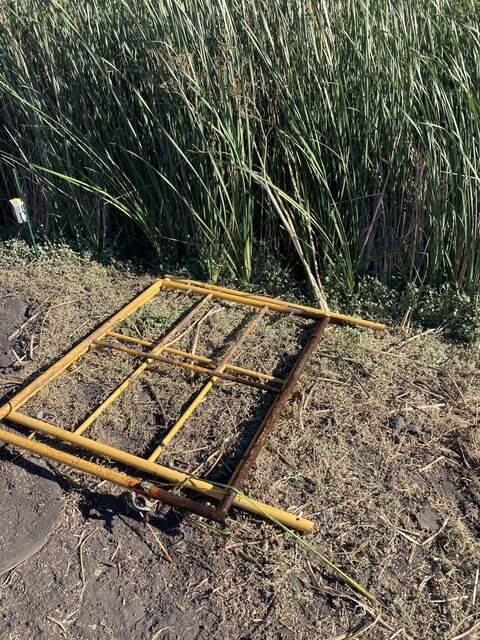
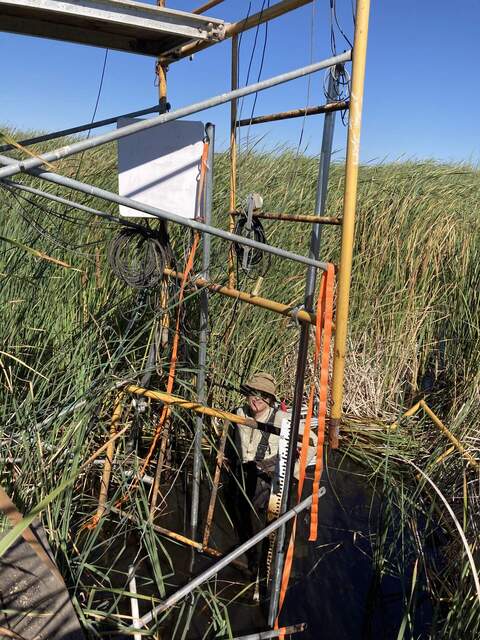
| 2024-09-11 Mayberry Joe and I arrived at 12:30 PST. It was sunny, mild, and breezy. It took us about two hours to drive here from Hill Slough. There was construction traffic on Hwy 12 approaching Rio Vista, so we detoured along Currie Road, Anderson Road, and Montezuma Hills Road into downtown Rio Vista. Then the Rio Vista Bridge was up, so we waited a while anyways. The water level was come up at least 10cm since our last visit, and the water level read 67.5cm. Despite the higher water level, the cattails also seem taller than two weeks ago, especially north of the tower. There were sheep on the interior levee road and they’ve eaten most of the vegetation near our solar panel and parking spot. Still some pepperweed left near the wetland edges. Today we are working to replace the bottom scaffolding level on the east side. This side had one broken and one buckled post. We used a new-ish scaffolding layer we took from West Pond and two screw jack feet we took from Hill Slough. We removed everything from the lower level of scaffolding: staff gauge, sonic rangefinder, various zip-tied cables, the floating boom. Joe removed the boardwalks from the bottom and second level of scaffolding and used a ratchet strap to support the weight boardwalk pathway from the second level of scaffolding (it was previously resting on the bottom scaffolding). I downloaded met, cam, and USB GHG data. Joe cleaned flux and read sensors and topped off the wash reservoir. I changed the eddy clock from 12:40 to 12:41:30 PST to match the laptop time and restarted logging. I measured the surface water conductivity. Surface, 1081uS, 21.8C The 7500 read: 407ppm CO2, 630mmol/m3 H2O, 27.0C, 100.2kPa, 105SS - 106 after cleaning The 7700 read: 2.08ppm CH4, 39RSSI - 71 after cleaning Joe added two long pipes on the east side of the tower. At the bottom they were supported by concrete piers he had placed in the water. The top of the pipes were clamped to the second level of scaffolding. He added a third concrete pier to the water near the middle of the scaffolding to support the sheepherder jack. He jacked up the scaffolding and I climbed a ladder to tighten the bolts on the post clamps so they could temporarily hold up the top of the tower taking the weight off the lowest frame. Joe jammed a post on the northeast corner of the tower to give it some lateral support. After disconnecting the bottom frame it practically fell off. We used bungee cords to attach new screw jack feet to the new scaffolding, and slipped the new scaffolding layer in. We added concrete piers (wood was removed) under the new feet. We leveled the tower. The southeast corner is not quite resting on its foot, maybe because the tower spent so long tilted toward the channel. We definitely disturbed the vegetated-red sipper profile, but I think Kyle is planning on removing those. We put the sonic rangefinder and Campbell conductivity sensor back in the water. The staff gauge is zip-tied back on at the same height (its original hardware was rusted). The floating boom was put back temporarily using a non-swivel clamp, so it won’t change heights with the water level. We couldn’t remove the old swivel clamp from the old scaffolding. The instrument heights and orientations should all be the same, although maybe we kicked some of the water sensors around. I checked the data afterwards and all looked ok. To-do: - Remove one more concrete pier from under the water (near the staff gauge) - Conduit hanger for staff gauge - Tie-down for fence post - Limb saw to trim 4x4 to lower camera and lower dfPAR so they don’t shade the radiometers - Swivel clamp for floating boom - Upgrade power strip for met box - Remove sippers? - Replace other bottom scaffolding (west side) We left around 16:00 PST. |
2 photos found

20240911MB_RustedFrame.jpg ( 2024-09-11 16:22:37 ) Full size: 1440x1920
Rusted frame removed from Mayberry, compared to a fresh scaffolding layer.

20240911MB_JoeJackedScaffolding.jpg ( 2024-09-11 15:10:57 ) Full size: 1440x1920
Joe with jacked-up scaffolding. The east side of the tower is supported by two long metal posts clamped to the second level of the scaffolding.
11 sets found
7 MB_flux graphs found
No data found for MB_met.
28 MB_tule graphs found
Can't check MBWPEESWGT_mixed
1 MB_cam graphs found
Can't check MBEEWPSWEPGT_cam
Can't check SIMBTWEE_met
1 MB_minidot graphs found
Can't check MBSWEEWPBCBA
1 MB_processed graphs found
Can't check MB_fd
1 MB_fd graphs found

