Field Notes
<--2024-08-21 11:15:00 | 2024-09-27 09:40:00-->Other sites visited today: Vaira
Phenocam link: Searching...
Tonzi: 2024-09-10 10:30:00 (DOY 254)
Author: Joe Verfaillie
Others: Kuno, Gerardo
Summary: Standard fieldwork, Kuno adding/measuring more stem/ground fluxes, JPL stuff removed, Trees a bit yellow/brown
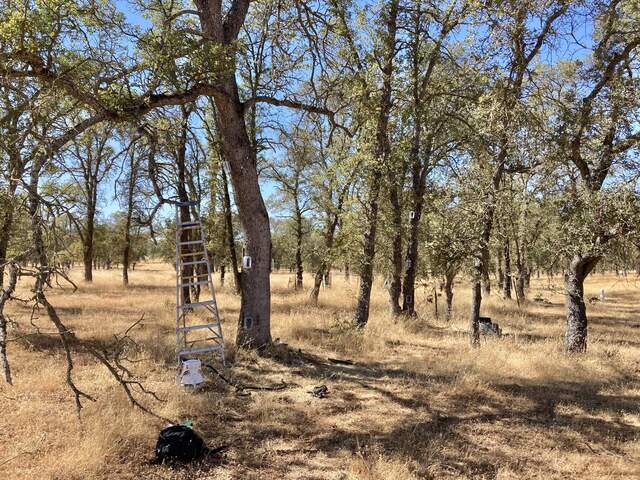
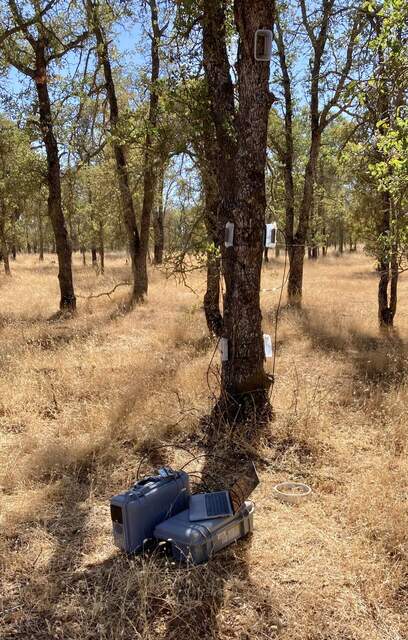
| Tonzi 2024-09-10 Kuno and I arrived at about 11:30 PDT. It was mild and dry. Many of the trees were tinged with yellow and brown. Gerardo from JPL had arrived earlier and was just beginning to remove their equipment. He removed everything except the solar panels and power line to the tower. He said we are welcome to use them. Kuno is expanding his stem/trunk chamber measurements and soil fluxes. In total, 30 chambers were installed for five trees. Each tree has two chambers per height and installation heights were 0.4m, 1.3m, and 2.7m. In addition to CO2, CH4 and N2O flux measurements, bark temperature and moisture was measured and tree diameter at breast height. One soil GHG flux sampling collar for smart chamber was installed proximity to each tree with stem chambers. Close to each collar, soil moisture, temperature and conductivity was measured, and soil samples were collected for C and N analyses. Soil CO2, CH4 and N2O fluxes were very small (< 1 nmol m-2 s-1). However, all soil collars were very small CH4 sinks. Most of the trees were CO2 and N2O (negligible) sources while being small CH4 sinks. Next time: installing 6 additional chambers plus relocating some of the soil collars from first campaign, so in total we have 10 soil ghg sampling spots. I did the standard fieldwork. I measured the Moisture Points, well level and read the dendrometers. I collected the Floor fluxes and the Floor and Road well data and the FD data. I collected the Tower flux, met and camera data late in the day. I did midday water potential and serviced the z-cams. I was prepared to redo the windows on z-cam 2 and 3, but I could not push the glass off the box lid with my fingers so assumed they are still water tight. Some of the edges of the silicon are loose but seems there is still enough between the glass and box lid for a tight seal. The Floor read: 425.8 ppm CO2, 553.7mmol/m3 H2O, 27.4C, 98.6kPa, 96.9SS The Tower read: 409.3ppm CO2, 499.6mmol/m3 H2O, 28.1C, 98.3kPa, 945SS I went to Vaira about 14:30 PDT and returned at about 15:30 PDT the finish up and wait for Kuno to finish the chamber work. We left at about 17:30 PDT |
Field Data
No tank data
Well Depth
| Date | Location | Depth (feet) |
|---|---|---|
| 2024-09-10 | TZ_floor | 26.4 |
| 2024-09-10 | TZ_road | 35.55 |
| 2024-09-10 | TZ_tower | 31 |
| 2024-09-10 | VR_well | 58.05 |
| 2024-09-10 | VR_pond | 14.04 |
No TZ Moisture Point data found
No VR Moisture Point data found
No TZ grass heigth found
No VR grass heigth found
Tree DBH
| Date | Tag# | Reading (mm) |
|---|---|---|
| 2024-09-10 | 1 | 8.2 |
| 2024-09-10 | 102 | 4.1 |
| 2024-09-10 | 2 | 17.1 |
| 2024-09-10 | 245 | 10.9 |
| 2024-09-10 | 3 | 9.3 |
| 2024-09-10 | 4 | 11.5 |
| 2024-09-10 | 5 | 21.2 |
| 2024-09-10 | 6 | 9.0 |
| 2024-09-10 | 7 | 16.7 |
| 2024-09-10 | 72 | 10.3 |
| 2024-09-10 | 79 | 9.9 |
Water Potential - mode: raw
| Time | Species | Tree | readings (bar) | ||
|---|---|---|---|---|---|
| 2024-09-10 11:53:00 | OAK | 102 | -42 | -38 | -36 |
| 2024-09-10 11:53:00 | OAK | 92 | -41 | -42 | -45 |
No TZ Grass Biomass data found
No TZ OakLeaves Biomass data found
No TZ PineNeedles Biomass data found
2 photos found

20240910TZ_ChamberTreeChambers.jpg ( 2024-09-10 15:17:40 ) Full size: 1920x1440
Ladder and tree trunk gas flux chambers at Tonzi

20240910TZ_AnalyzersTreeChambers.jpg ( 2024-09-10 15:18:03 ) Full size: 1223x1920
Analyzers doing tree trunk flux measurements
16 sets found
No data found for TZ_Fenergy.
11 TZ_tmet graphs found
No data found for TZ_soilco2.
Can't check TZ_mixed
3 TZ_mixed graphs found
1 TZ_fflux graphs found
8 TZ_fmet graphs found
No data found for TZ_tram.
3 TZ_co2prof graphs found
1 TZ_irt graphs found
No data found for TZ_windprof.
1 TZ_tflux graphs found
8 TZ_sm graphs found
Can't check TZ_met
1 TZ_met graphs found
Can't check TZVR_mixed
8 TZ_osu graphs found
3 TZ_fd graphs found
Tonzi Z-cam data

