Field Notes
<--2024-07-09 14:50:00 | 2024-07-22 11:25:00-->Other sites visited today: Bouldin Alfalfa | East End | Gilbert Tract
Phenocam link: Searching...
Bouldin Corn: 2024-07-17 08:35:00 (DOY 199)
Author: Daphne Szutu
Others: Robert
Summary: Weedy corn, removed two wasp nests, updated CR1000 datalogger program to edit modified Bowen calc, changed zcam settings to take 24hr photos
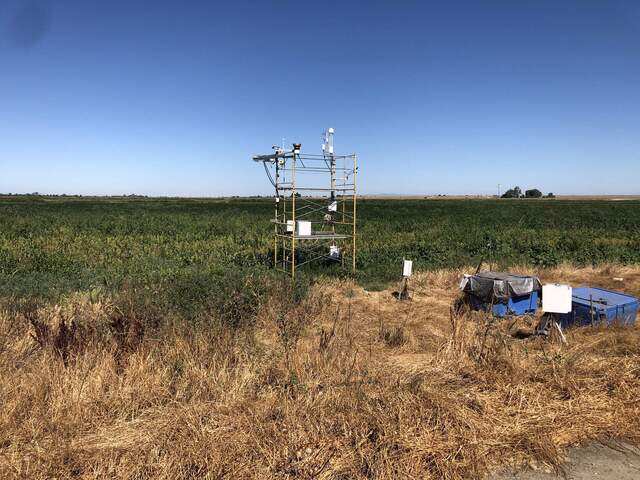
| 2024-07-17 Bouldin Corn Robert and I arrived at 8:35 PST (9:35 PDT). It was sunny and breezy with hazy horizons. The whole corn field is very weedy this year, not just our corner. Other corn fields we passed have a homogenous corn canopy like we usually see. Robert and I discussed how to get rid of the wasps nest. The wasps themselves weren’t too active yet because it was still relatively cool. There were two visible nests in the east-facing openings of the radiometer boom, only one of which I had noticed last time. We decided to wait until the end of the site visit to disturb them. I downloaded met, cam, USB GHG, and PA data. The lithium power pack I added in last time as an “in-line” power source on the 24V line only had one LED light remaining. I confirmed that it was on, so it should be both charging and discharging. Robert cleaned the flux sensors but skipped the rad sensors because he didn’t want to disturb the wasp nests. I topped off the wash reservoir. I updated the CR1000 datalogger program to edit the modified Bowen-variance method calculations. It now uses a constant pressure instead of no air pressure data to calculate qsat. I also removed the code for the PRI sensors (sensors are still on the boom). I plugged the Apogee NDVI sensors back in (left NDVI and PRI unplugged last time); I was going to remove the Apogee NDVI sensors from this tower, but since they’re still producing reasonable data, I’ll keep them for now. I downloaded the zcam data and changed their settings so they do NOT skip nighttime images. I noticed some of the images were blurry, so I sent Robert out into the field to find the two cameras and wipe their lenses. I restarted the zcams after changing their settings and confirmed the photos looked much better after Robert cleaned them. The 7500 read: 423ppm CO2, 617mmol/m3 H2O, 21.8C, 101.6kPa, 101SS after cleaning The 7700 read: 1.95ppm CH4, 81RSSI after cleaning To get a better angle on the wasps, we shifted the upper boardwalk to the east side of the tower. I sprayed the two nests with our pump sprayer and used the end of the sprayer to poke the nests out of the boom. I added a rubber cap to both of the open, east-facing ends of the rad boom. Robert was wary of disturbing the nests at all, but I think coming first thing in the morning while the wasps were still relatively cool helped a lot to keep them relatively subdued. Also the narrow opening the boom meant that I could pretty much spray each individual wasp as it flew out. We moved the upper boardwalk back to the west side of the tower, and Robert cleaned the rad sensors. He also added a plastic cap to the top, west-facing end of the rad boom. The bottom, west-facing end of the rad boom was not as accessible from the tower. We left at 9:25 PST (10:25 PDT). Patty was at her Chico site today setting everything up, and called me for help with her Chico program. Her serial sensors (LI-7200 and CSAT3B) on the CR1000X were both nan. |
1 photos found

20240717BC_SorghumFlowers.jpg ( 2024-07-17 10:24:45 ) Full size: 1920x1440
Once the flowers appeared on the stalks, it started to seem like this field was not planted with corn after all...
6 sets found
17 BC_met graphs found
5 BC_flux graphs found
Can't check TATWBABCSB_cam
Can't check MBSWEEWPBCBA
2 BC_pa graphs found
1 BC_arable graphs found

