Field Notes

<--2024-05-07 11:05:00 | 2024-05-31 14:30:00-->
Other sites visited today: Gilbert Tract | East End | Bouldin Corn
Phenocam link: Searching...

Mayberry: 2024-05-23 12:25:00 (DOY 144)
Author: Daphne Szutu
Others: Robert

Summary: Regular data collection/cleaning, breezy, picam tilted--fixed

2024-05-23
Mayberry

Robert and I arrived at 12:25 PST (13:25 PDT). It was sunny, warm, and breezy with an occasional gust. From the levee road driving in, the wetland looks mostly green. There is a patch just west of the tower that looks more brown/grey than most other areas. The staff gauge read 40cm.

I downloaded met, cam, USB GHG, and miniDOT data. We swapped the miniDOT and water level desiccant. I changed the eddy clock +1min around 12:33 PST to match the laptop time and restarted logging. The picam had tilted again; I adjusted it and need to tighten the bolt next time. Robert topped off the wash reservoir, cleaned flux and rad sensors, and measured the surface water conductivity.

Sample, temperature-compensated conductivity, temperature
Surface, 1623 uS, 22.5 C, no units written on field note so unit is a guess

The 7500 read: 430ppm CO2, 440mol/m3 H2O, 26.6C, 100.4kPa, 98SS – 100 after cleaning
The 7700 read: 2.04ppm CH4, 51RSSI – 73 after cleaning

We left at 12:50 PST (13:50 PDT).

1 photos found

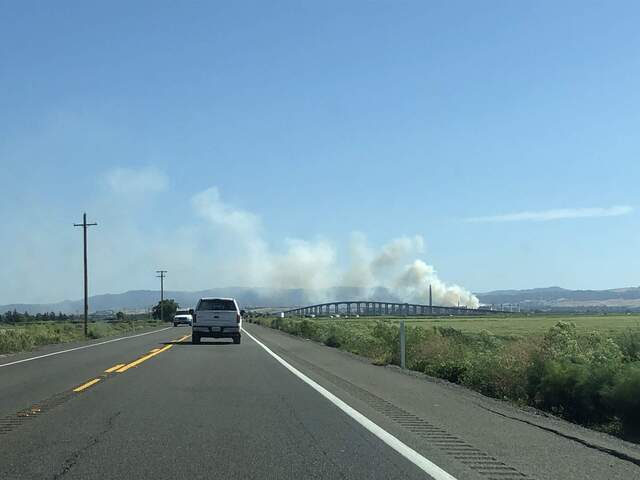
Brush smoke from a fire near the Antioch BART station
20240523MB_AntiochSmoke.jpg ( 2024-05-23 16:19:23 ) Full size: 1920x1440
Brush smoke from a fire near the Antioch BART station

Graphs display:
11 sets found

7 MB_flux graphs found

Explore the graph:Sonic Wind in a new window

Explore the graph:LI7700 mV signals in a new window

Explore the graph:Counts in a new window

Explore the graph:LI7700 CH4 from analog signal in a new window

Explore the graph:LI7500 CO2 and H2O in a new window

Explore the graph:LI7700 CH4 from digital signal in a new window

Explore the graph:CO2 in ppm in a new window

No data found for MB_met.
27 MB_tule graphs found

Explore the graph:MB Tule Tower: Open Water 2 (3/1/11-3/23/17) in a new window

Explore the graph:MB Tule Tower: Open Water 1 (3/1/11-2/21/13) in a new window

Explore the graph:MB Tule Tower: Tule Temps 2 & 3 (3/1/11-3/19/14) in a new window

Explore the graph:MB Tule Tower: Tule Temps 1 (3/1/11-3/19/14) in a new window

Explore the graph:Mayberry Tule Tower: Solar Radiation in a new window

Explore the graph:Mayberry Tule Tower: Disolved Oxygen in a new window

Explore the graph:Mayberry Tule Tower: IRT and Sensor Temp in a new window

Explore the graph:Mayberry Tule Tower: Volts and RH in a new window

Explore the graph:LED NDVI Sensor in a new window

Explore the graph:Water CO2 in a new window

Explore the graph:Water Pressure in a new window

Explore the graph:Fluorometer Data in a new window

Explore the graph:Mayberry pCO2 Profile in a new window

Explore the graph:Water Temperatures in a new window

Explore the graph:Air Temperatures in a new window

Explore the graph:Air Pressure in a new window

Explore the graph:4-Way Radiometer in a new window

Explore the graph:MB Tule Tower: Open Water 1 (2/21/13-3/19/14) in a new window

Explore the graph:MB Tule Tower: Tule Temps 1 (3/19/14-now) in a new window

Explore the graph:MB Tule Tower: Open Water 1 (3/19/14-now) in a new window

Explore the graph:MB Tule Tower: Tule Temps 2 & 3 (3/19/14-3/23/17) in a new window

Explore the graph:MB Tule Tower: Tule Temps 2 (3/23/17-now) in a new window

Explore the graph:MB Tule Tower: Tule Temps 3 (3/23/17-now) in a new window

Explore the graph:SRS NDVI Channels in a new window

Explore the graph:SRS NDVI in a new window

Explore the graph:Net Radiation in a new window

Explore the graph:Conductivity in a new window

Can't check MBWPEESWGT_mixed
1 MB_cam graphs found

Explore the graph:Mayberry Autocam GCC in a new window

Can't check MBEEWPSWEPGT_cam
Can't check SIMBTWEE_met
1 MB_minidot graphs found

Explore the graph:Mayberry miniDot Dissolved Oxygen in a new window

Can't check MBSWEEWPBCBA
No data found for MB_processed.
Can't check MB_fd
1 MB_fd graphs found

Explore the graph:Water Forced Diffusion CO2 Flux in a new window