Field Notes
<--2010-11-18 09:30:00 | 2010-12-09 12:30:00-->Other sites visited today: Mayberry | Sherman Island
Phenocam link: Searching...
Twitchell Rice: 2010-12-02 07:20:00 (DOY 336)
Author: Joe Verfaillie
Others: Cristina
Summary: Checked on new generator, copied data, calibrated LGR, checked sonic heading.
| Twitchell
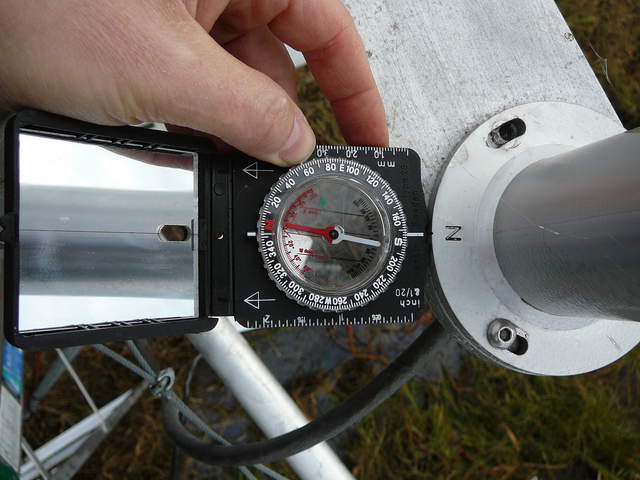
12/2/2010 I arrived about 7:20 PST with Cristina. It was cool with very little wind and overcast. There were no water birds on the fields. The water level looked a little higher and water seemed to be still flowing onto the field. There was a strong sulfur / bird poop / wet rotten order. The Bermuda grass was largely dead probably due to frost and damp with dew. The UC Davis pallets have been removed (stolen?). The sign generator was running where the end of our power was. The LGR was running in high flow mode. 7:22PST, 27.97C, 145.54Torr, 16.093usec, 10Hz, 2.528ppm The computer was off and not plugged into the serial lines yet. I booted it up and connected to the data loggers. All looked well. I copied the back logged met data and swapped the card on the CR1000. There’s no Slow data on the card – strange. The file is on the card and seems to have data but Card Convert will not see it. The 10Hz file seems good. While I was waiting for data to transfer I checked the LGR in slow flow mode. Previously low flow mode had very low pressures ~60Torr, but this time it help steady at 143Torr. So I calibrated the LGR with 3.276ppm CH4. Last cal was on September 8, 2010. It hadn’t been calibrated more recently because of the low pressure in slow flow mode. Pre cal: 7:43PST, 24.90C, 142.80Torr, 16.064usec, 1Hz, 2.660ppm - off by 616ppb a lot. Post cal CH4 was 3.263ppm And back in operation after adjusting the bypass valve because pressure was too high: 7:53PST, 23.33C, 143.96Torr, 16.089usec, 10Hz, 3.266ppm I took a photo of the sonic heading with the compass. I wiped dew off the pyranometer. |
1 photos found

20101202TW_SonicOrientation.jpg ( 2010-12-02 08:22:22 ) Full size: 2560x1920
Compass heading of rice sonic
6 sets found
12 TW_met graphs found
5 TW_flux graphs found
Can't check TWSI_mixed
Can't check SIMBTWEE_met
No data found for TW_cam.
Can't check TATWBABCSB_cam

