Field Notes
<--2023-10-11 10:05:00 | 2023-10-27 10:40:00-->Other sites visited today: Bouldin Alfalfa | Bouldin Corn | Hill Slough
Phenocam link: Searching...
Gilbert Tract: 2023-10-26 10:10:00 (DOY 299)
Author: Daphne Szutu
Others: Dennis, Arman
Summary: Regular data collection/cleaning, 7550 blown fuse--removed, dropped off fDOM calibration solution for USGS
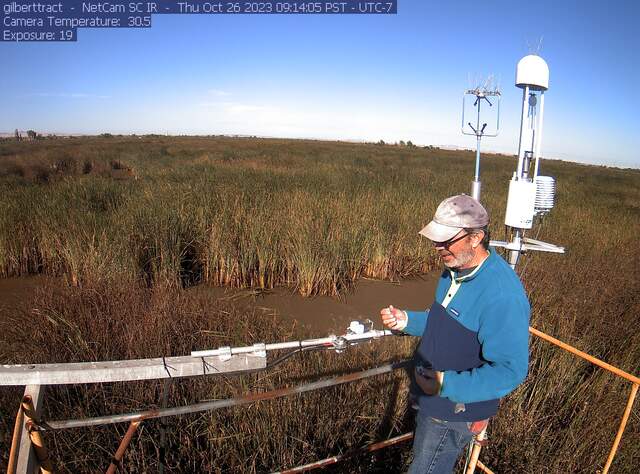
| 2023-10-26 Gilbert Tract Dennis, Arman, and I arrived at 10:10 PDT after picking up Arman at the Pleasant Hill BART station. Today was Arman’s first visit to the Delta. It was sunny and mild, a lovely fall day. There is some construction going on in the ditch on the southern border of Gilbert Tract, between the wetland the Delaney Park. The staff gauge read 30cm at 9:49 PST. We met with James and Lyndsay from USGS to exchange calibration standards. I gave them a bottle of freshly prepared fDOM standard and they gave us some expired turbidity and conductivity standards. I downloaded met, cam, and USB GHG data. Dennis and Arman cleaned flux and rad sensors. The reservoir was 80% full; we refilled it. The 7550 was off and the fuse was blown. Last data was from 2023-10-18. I confirmed that the 7550 was getting 24V from the screw terminal. The 7700 was on and seemed to be running, but I didn’t check its numbers. I called Oakley Ace Hardware and had them hold a package of fuses at the front desk: 5A, 125V, fast-blow fuse 5x20mm, 2 fuses for about $9. Dennis went to go buy them while Arman and I downloaded the ADCP data. We walked down to the channel around 11:00 PDT. I downloaded Flo’s data, reset the clock, and restarted logging. We walked back to the main tower and Dennis returned shortly. I unscrewed the 7550 power cable, put a new fuse in, and the fuse blew immediately. We brought the 7550 sn AIU-1866 back to the lab for further testing. We left at 11:35 PDT. |
1 photos found

gilberttract_2023_10_26_091405.jpg ( 2023-10-26 17:19:02 ) Full size: 1296x960
Dennis cleaning the radiometers
8 sets found
Can't check MBWPEESWGT_mixed
Can't check MBEEWPSWEPGT_cam
16 GT_met graphs found
4 GT_flux graphs found
3 GT_adcp graphs found
1 GT_cam graphs found
2 GT_usgs graphs found
No data found for GT_chanexo.

