
Field Notes
<--2022-08-31 10:10:00 | 2022-09-29 14:35:00-->Other sites visited today: Hill Slough | Bouldin Corn
Phenocam link: Searching...
Bouldin Alfalfa: 2022-09-16 13:05:00 (DOY 259)
Author: Daphne Szutu
Others: Carlos
Summary: Regular data collection/cleaning, many wasps around, field being baled, checked on Arables, trimmed alfalfa under towers, soil moisture cores, spectral, first fall precip expected soon, record-break heat wave last week
| 2022-09-16 Bouldin Alfalfa Carlos and I arrived, ate lunch, and started at the main tower around 13:05 PDT. It was warm and sunny. The horizons were very hazy and the sky was overall hazy, so Carlos decided to skip the manual IRT measurements on alfalfa today. Our first fall precip event is expected in a few days. Last week 2022-09-05 to 2022-09-08, most the Bay Area had a record-breaking heat wave with 3 days of all-time high temperatures recorded at this site. 1. 42.8 C (2022-09-06) 2. 42.1 C (2022-09-05) 3. 41.9 C (2022-09-08) 6. 39.8 C (2022-09-07) 9. 39.2 C (2022-09-09) Carlos decided to skip the manual IRT measurements today. The field has been mowed and a farmer was working on baling our field when we arrived. The alfalfa was so sparse this round that there were only 5-6 bales for the whole field. We trimmed the alfalfa under all of the towers and under the PL Arable. Joe asked me to check on the Arables here because none of them seem to be fully working. On the sn C003240, the bottom status light was off and the top status light for battery and thermometer were red. GPS and network lights were green. When I tried again to press the top button, no lights came on at all. Holding down the top button for a while didn't change anything; all lights remained off. This Arable is connected to the Arable box that connected to the soil profile rod. sn C006164 had a red light for the thermometer and all the other top lights were green. The bottom status light was green. I held down the top button for a while to restart it. After about 10 min, the battery light was green and the other 3 lights were blinking orange. Not sure how long it takes to restart. The bottom status light was still green. The PL Arable sn C011018 was similar, with a red light for the thermometer and all other top lights green. The bottom status light was blinking orange, not green. I did a reset here with the same result, with a green battery light and the other 3 lights blinking orange. At the main tower, there were a bunch of wasps buzzing around, although I didn't see any nests. Carlos and I downloaded the data and I cleaned flux and rad sensors. SWin and LWin were both dirty with streaked mud. We set the eddy clock +1min from 13:02:40 to 13:03:40. I restarted logging. Carlos took a soil sample (0-5cm), spectral measurements, and we estimated the veg height to be around 10cm. The 7500 read: 389ppm CO2, 689mmol/m3 H2O, 27.0C, 101.3kPa, 94SS – 100 after cleaning. Bouncer Tower We arrived at the bouncer tower at 14:30 PDT. I downloaded data and Carlos trimmed alfalfa and cleaned the 7500 and solar panels. I synched the eddy and laptop clocks +30sec from 13:30:00 to 13:30:30 and restarted logging. Carlos took a soil sample (0-5cm). The 7500 read: 410ppm CO2, 577mmol/m3 H2O, 28.5C, 101.3kPa, 95SS – 99 after cleaning. Edge Tower We arrived at the edge tower at 14:50. I downloaded data and Carlos trimmed alfalfa and cleaned the 7500 and solar panels. I synched the eddy and laptop clocks +30sec around 13:55 and restarted logging. Carlos took a soil sample (0-5cm). The 7500 read: 399ppm CO2, 675mmol/m3 H2O, 30.1C, 101.3kPa, 98SS – 101 after cleaning. We left at 15:15 PDT. Robert is doing his Oakley transects today on the e-bike. We called him to check in and he said everything was going shipshape. Looking at the data back in the lab, SHF2 is dropping out at night--I'll check the wiring next time. LWin has a lot of spikes that started since the previous visit - maybe just because the sensor was dirty? |
Next Mowing: 2022-10-27
1 photos found
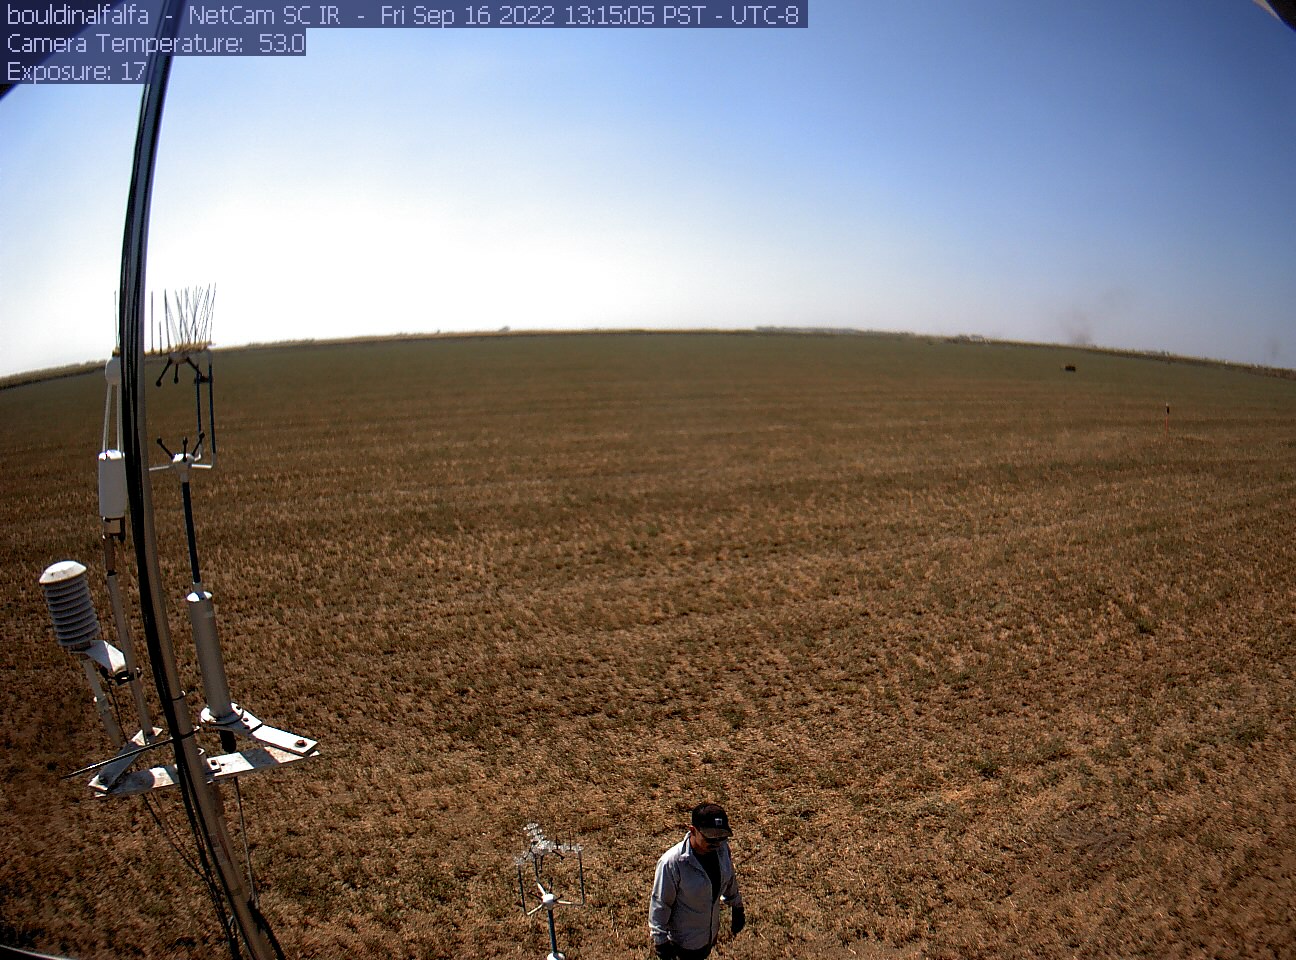
bouldinalfalfa_2022_09_16_131505.jpg ( 2022-09-16 14:17:56 ) Full size: 1296x960
Carlos on site
7 sets found
4 BA_flux graphs found
21 BA_met graphs found
6 BA_arable graphs found
Can't check TATWBABCSB_cam
Can't check MBSWEEWPBCBA
2 BA_processed graphs found
11 BA_adex graphs found