
Field Notes
<--2022-09-16 13:05:00 | 2022-10-18 11:45:00-->Other sites visited today: Hill Slough | Bouldin Corn
Phenocam link: Searching...
Bouldin Alfalfa: 2022-09-29 14:35:00 (DOY 272)
Author: Daphne Szutu
Others: Ari
Summary: Regular data collection/cleaning, restarted two Arables, SHF2 gaps--not fixed, LWin spikes--cleaned, soil samples for soil moisture
| 2022-09-29 Bouldin Alfalfa Ari and I arrived to the main tower at 14:35 PDT. It was mild and warm with clear skies and a hazy horizon. The alfalfa is growing back more vigorously and is greener than I remember in the past few months. Maybe the rain about 10 days ago helped. I thought they might be done harvesting for the year, but farmers were mowing an alfalfa field northeast of us, so there might be one more harvest to go. There were still plenty of wasps buzzing around the main tower, but fewer than last visit. They like to hang out in the ADEX enclosure. Ari started with taking spectral and veg height measurements. I started with checking on some of the Arables. I did a hard reset on the Planet labs Arable (sn C011018); instead of a paper clip I temporarily removed on the bird spikes from the Arable. The reset took a few minutes, and afterwards all four status lights on top and the one on bottom were all green. At the tower, I restarted sn C006164 by pressing the top button for 3sec. Three status lights on top were green; 1 status light (thermometer icon) and bottom status light were both red. No response from sn C003240 when I pressed the top button, but Joe said it seemed to be sending data. Arable said both sn C006164 and sn C003240 have bad T/RH sensors, and they'll send us replacements Ari cleaned flux and rad sensors. She reported that the LWin sensor felt greasy and had to be wiped several times before it felt clean. Maybe an herbicide that was sprayed over the field? None of the other sensors seemed greasy. There have been dropouts in SHF2 and spikes in LWin. I checked their wiring but all seems secure. Maybe the LWin spikes are from the grease or other fouling. Not sure what's wrong with SHF2. I unplugged and replugged all the mux blocks in case that would help. I collected the flux, met, camera, FD, ADEX and Corteva IRT data. I adjusted the eddy clock +~30sec and restarted logging. I initially got the blank BA and BA ADEX CF cards mixed up, but I figured it out because the CFM100 on the BA ADEX CR1000 only accepts cards up to 2 GB, so the blank BA 16 GB card wasn't mounting properly. I got all the data properly downloaded and correct cards inserted into each datalogger. The precip bucket had some bird poop in the funnel that we cleaned out. Ari took a soil sample (0-5cm) with the slide hammer for soil moisture. The 7500 read: 412ppm CO2, 647mmol/m3 H2O, 32.3C, 101.4kPa, 97SS – 99 after cleaning. Bouncer Tower We arrived at 16:00 PDT. I collected data. Ari cleaned the 7500 and Rnet sensors and took a soil sample (0-5cm) for soil moisture. I changed the eddy clock +30sec from 15:12 to 15:12:30 and restarted logging. I thought the lower sonic SOS looked weirdly stable compared to the main tower lower sonic SOS (but I was comparing a different hour of 20Hz data). This is the sonic wired to the CR6 (along with both T/RH sensors). I forgot to bring the CSI/O cable to connect to the CR6 (and the miniUSB port on the datalogger is busted), so I couldn't check the real-time data, but the wiring was secure and I power cycled the CR6 just in case that would help. At the Edge tower, the lower sonic SOS looked about the same as at the Bouncer Tower, so I think the data is real. The 7500 read: 414ppm CO2, 548mmol/m3 H2O, 32.2C, 101.3kPa, 99SS – 100 after cleaning. Edge Tower We arrived at 16:28 PDT. I collected data. Ari cleaned the 7500 and Rnet sensors and took a soil sample (0-5cm) for soil moisture. I changed the eddy clock +30sec around 15:35 PST and restarted logging. More wasps here in the enclosure. The 7500 read: 412ppm CO2, 636mol/m3 H2O, 31.3C, 101.3kPa, 101SS – 103 after cleaning. We left at 16:50 PDT. |
Next Mowing: 2022-10-27
Veg Height (cm): Tape measure from ground to top of plant
30, 9, 32, 10, 17, 15, 20, 10, 32, 14, avg = 18.9, stdev = 9.23
1 photos found
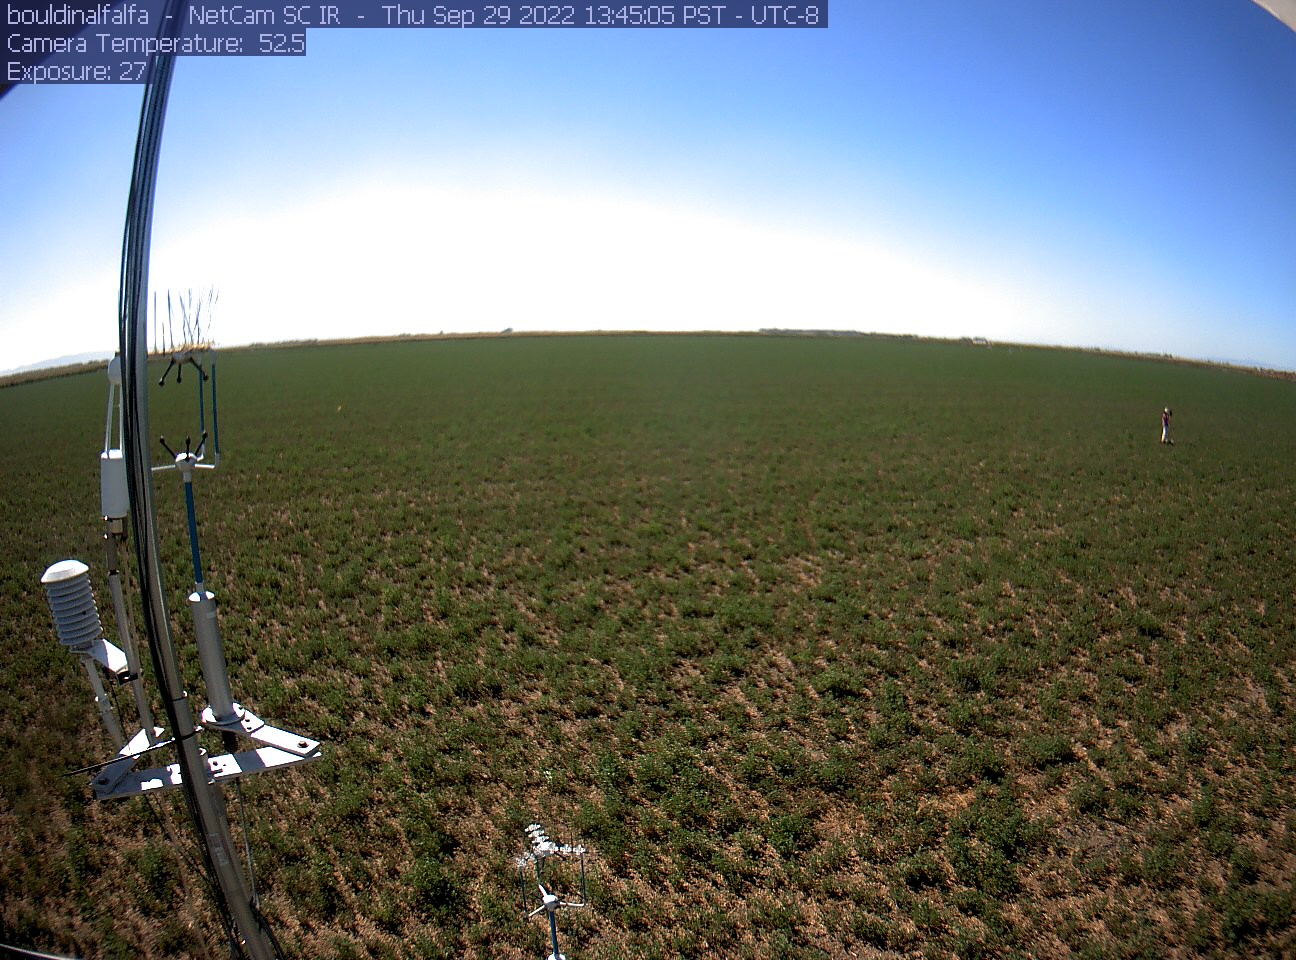
bouldinalfalfa_2022_09_29_134505.jpg ( 2022-09-29 14:48:48 ) Full size: 1296x960
Daphne on site
7 sets found
4 BA_flux graphs found
21 BA_met graphs found
6 BA_arable graphs found
Can't check TATWBABCSB_cam
Can't check MBSWEEWPBCBA
2 BA_processed graphs found
11 BA_adex graphs found