Field Notes
<--2022-08-25 15:30:00 | 2022-10-05 14:50:00-->Other sites visited today: Tonzi
Phenocam link: Searching...
Vaira: 2022-09-14 10:30:00 (DOY 257)
Author: Joe Verfaillie
Others:
Summary: Standard data collection, swapped 7500, very hot last week, looked for soil sensors.
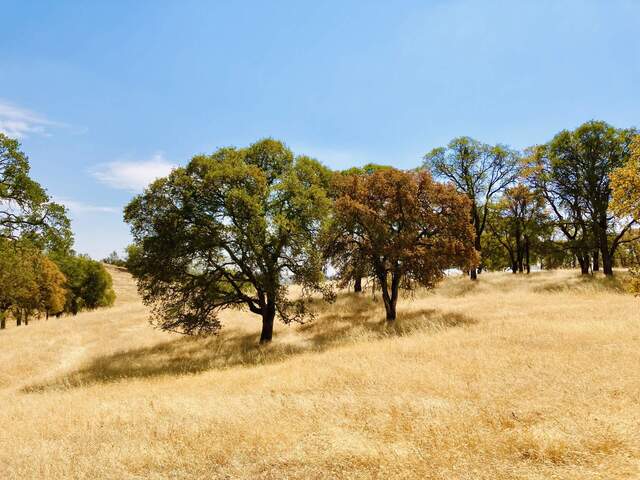
| Vaira 2022-09-14 I arrived at about 10:30 PDT. It was mild and sunny with a few high thin clouds and a breeze from the south. Last week was super hot with local temperatures above 40C (110F). The trees don’t look as bad as I thought they would, but it seems to be a little spotty. One tree will still be mostly green but its neighbor will be almost entirely brown. There’s a row of redwoods along Hwy16 near Sacramento that looked to be in bad shape too. I measured the well and collected the flux, met, camera and FD data. I swapped the 7500 for calibration: sn 75H-2667 came off and sn 0065 went on. 2667 read: 413.1ppm CO2, 500.4mmol/m3 H2O, 23.2C, 99.4kPa, 101.8SS 0065 read: 409.8ppm CO2, 500.7mmol/m3 H2O, 22.3C, 99.4kPa, 102.1SS I updated the pressure coefficients and restarted the box. I didn’t have a spare USB stick so I moved the files off the current one and replaced it. The locations and depths of the SHF plates and Theta probes are not precisely known. I thought at this time of year there is very little to disturb by digging around in the ground. The SHF plates were relatively easy to find as they were in conduit. All three were about 3-5cm below the surface. The Theta probes are not in conduit and there seems to be a rat’s nest of extra wire buried under the surface near the multiplexer box. This should be cleaned up and put in conduit along with the cables for the new SoilVue profiles. More than I have time for today. I went the pond. There were several deer nearby. Cows have kicked the conduit again. I did a better job of straightening the cable, fitting the conduit together, staking is down and burying it in rocks. I left at about 12:30 PDT |
Field Data
No tank data
Well Depth
| Date | Location | Depth (feet) |
|---|---|---|
| 2022-09-14 | VR_well | 59.05 |
| 2022-09-14 | VR_pond | 12.65 |
| 2022-09-14 | TZ_floor | 30.15 |
| 2022-09-14 | TZ_road | 38.15 |
| 2022-09-14 | TZ_tower | 34.65 |
No TZ Moisture Point data found
No VR Moisture Point data found
No TZ grass heigth found
No VR grass heigth found
No VR Tree DBH found
No water potential data found
No VR Grass Biomass data found
No VR OakLeaves Biomass data found
No VR PineNeedles Biomass data found
1 photos found

20220914VR_GreenBrownTrees.jpg ( 2022-09-14 12:22:33 ) Full size: 1920x1440
Some trees seem to be ok other not so much
9 sets found
16 VR_met graphs found
2 VR_flux graphs found
No data found for VR_soilco2.
2 VR_pond graphs found
Can't check TZVR_mixed
3 VR_fd graphs found
4 VR_processed graphs found
4 VR_arable graphs found
6 VR_soilvue graphs found

