
Field Notes
<--2022-08-25 10:30:00 | 2022-10-05 10:50:00-->Other sites visited today: Vaira
Phenocam link: Searching...
Tonzi: 2022-09-14 12:40:00 (DOY 257)
Author: Joe Verfaillie
Others:
Summary: Standard data collection, swapped Tower battery nuts, swapped Floor 7500 to test sn 0418, changed fmet 23x and osusp1 CR3000 programs to fix data glitches
| Tonzi 2022-09-14 I arrive at about 12:40 PDT. It was mild, clear and sunny with a southerly breeze. Last week was super hot with local temperatures above 40C (110F). The trees don’t look as bad as I expected but they are pretty much all brown. The pines to the north are distinctly greener than the oaks. I adjusted the wooden frame for the battery roof so that the boxes can open. Then I replaced the zinc M8 nuts on the batteries with stainless steel nuts and managed not to disrupt the power. I didn’t notice any power problems but have not looked at all the data yet. While I was working on the batteries I troubleshot the Floor Met 23X and the OSU CR3000 to try to iron out the remaining issues with the SoilVue and METER soil water potential (SWP) sensors. On the Floor met, the first VWC number was -6999 on both SoilVue sensors. I changed the program to make six SDI-12 calls instead of one to each probe. There might be a 10min delay in the readings as there didn’t seem to be numbers for the first 10min scan but there were numbers for the second scan. On the CR3000 the SWP has been reading zero and one of the Echo TE probes has intermittent NaNs. I checked the wiring and didn’t see any problems. The SWP sensor was sharing a control port with the SoilVue probe. I disconnected the SoilVue to see if it was interfering and changed the program to call the SWP after the SoilVue in case the Soilvue was stepping on it. No improvements. I left the SWP disconnected and it was reporting NAN instead of zero. I could bring a CR1000 with me to test the SWP sensor by itself. It also seems there could be another free SDI-12 control port with some rewiring and program changes. For the Echo TE probes I might add a flag to filter NANs or change the port on the multiplexer. I collected the flux, met, camera, and FD data. I measured soil moisture, DBH and the wells. I swapped the 7500 on the Floor tower: sn 0035 came off and sn 0418 went on. 0418 was renovated by Licor in the spring but drifted significantly while it was on the Tonzi tower over the summer. We tested it in the lab for a couple weeks and decided it was stable enough to test it in a low priority location in the field. 0035 read: 416.0ppm CO2, 475.8mmol/m3 H2O, 26.9C, 98.9kPa, 99.5SS 0417 read: 404.2ppm CO2, 438.5mmol/m3 H2O, 26.2C, 99.0kPa, 94.3SS The signal strength was the same as in the lab. Tower read: 403.5ppm CO2, 475.8mmol/m3 H2O, 23.4C, 98.8kPa, 102.9SS Not enough green leaves to do tree water potential. I left at about 15:50 PDT |
Field Data
No tank data
Well Depth
| Date | Location | Depth (feet) |
|---|---|---|
| 2022-09-14 | VR_well | 59.05 |
| 2022-09-14 | VR_pond | 12.65 |
| 2022-09-14 | TZ_floor | 30.15 |
| 2022-09-14 | TZ_road | 38.15 |
| 2022-09-14 | TZ_tower | 34.65 |
No TZ Moisture Point data found
No VR Moisture Point data found
No TZ grass heigth found
No VR grass heigth found
Tree DBH
| Date | Tag# | Reading (mm) |
|---|---|---|
| 2022-09-14 | 1 | 5.2 |
| 2022-09-14 | 102 | 15.1 |
| 2022-09-14 | 2 | 17.8 |
| 2022-09-14 | 245 | 3.9 |
| 2022-09-14 | 3 | 20.9 |
| 2022-09-14 | 4 | 18.2 |
| 2022-09-14 | 5 | 10.7 |
| 2022-09-14 | 6 | 21.3 |
| 2022-09-14 | 7 | 12.1 |
| 2022-09-14 | 72 | 15.5 |
| 2022-09-14 | 79 | 13.4 |
No water potential data found
No TZ Grass Biomass data found
No TZ OakLeaves Biomass data found
No TZ PineNeedles Biomass data found
1 photos found
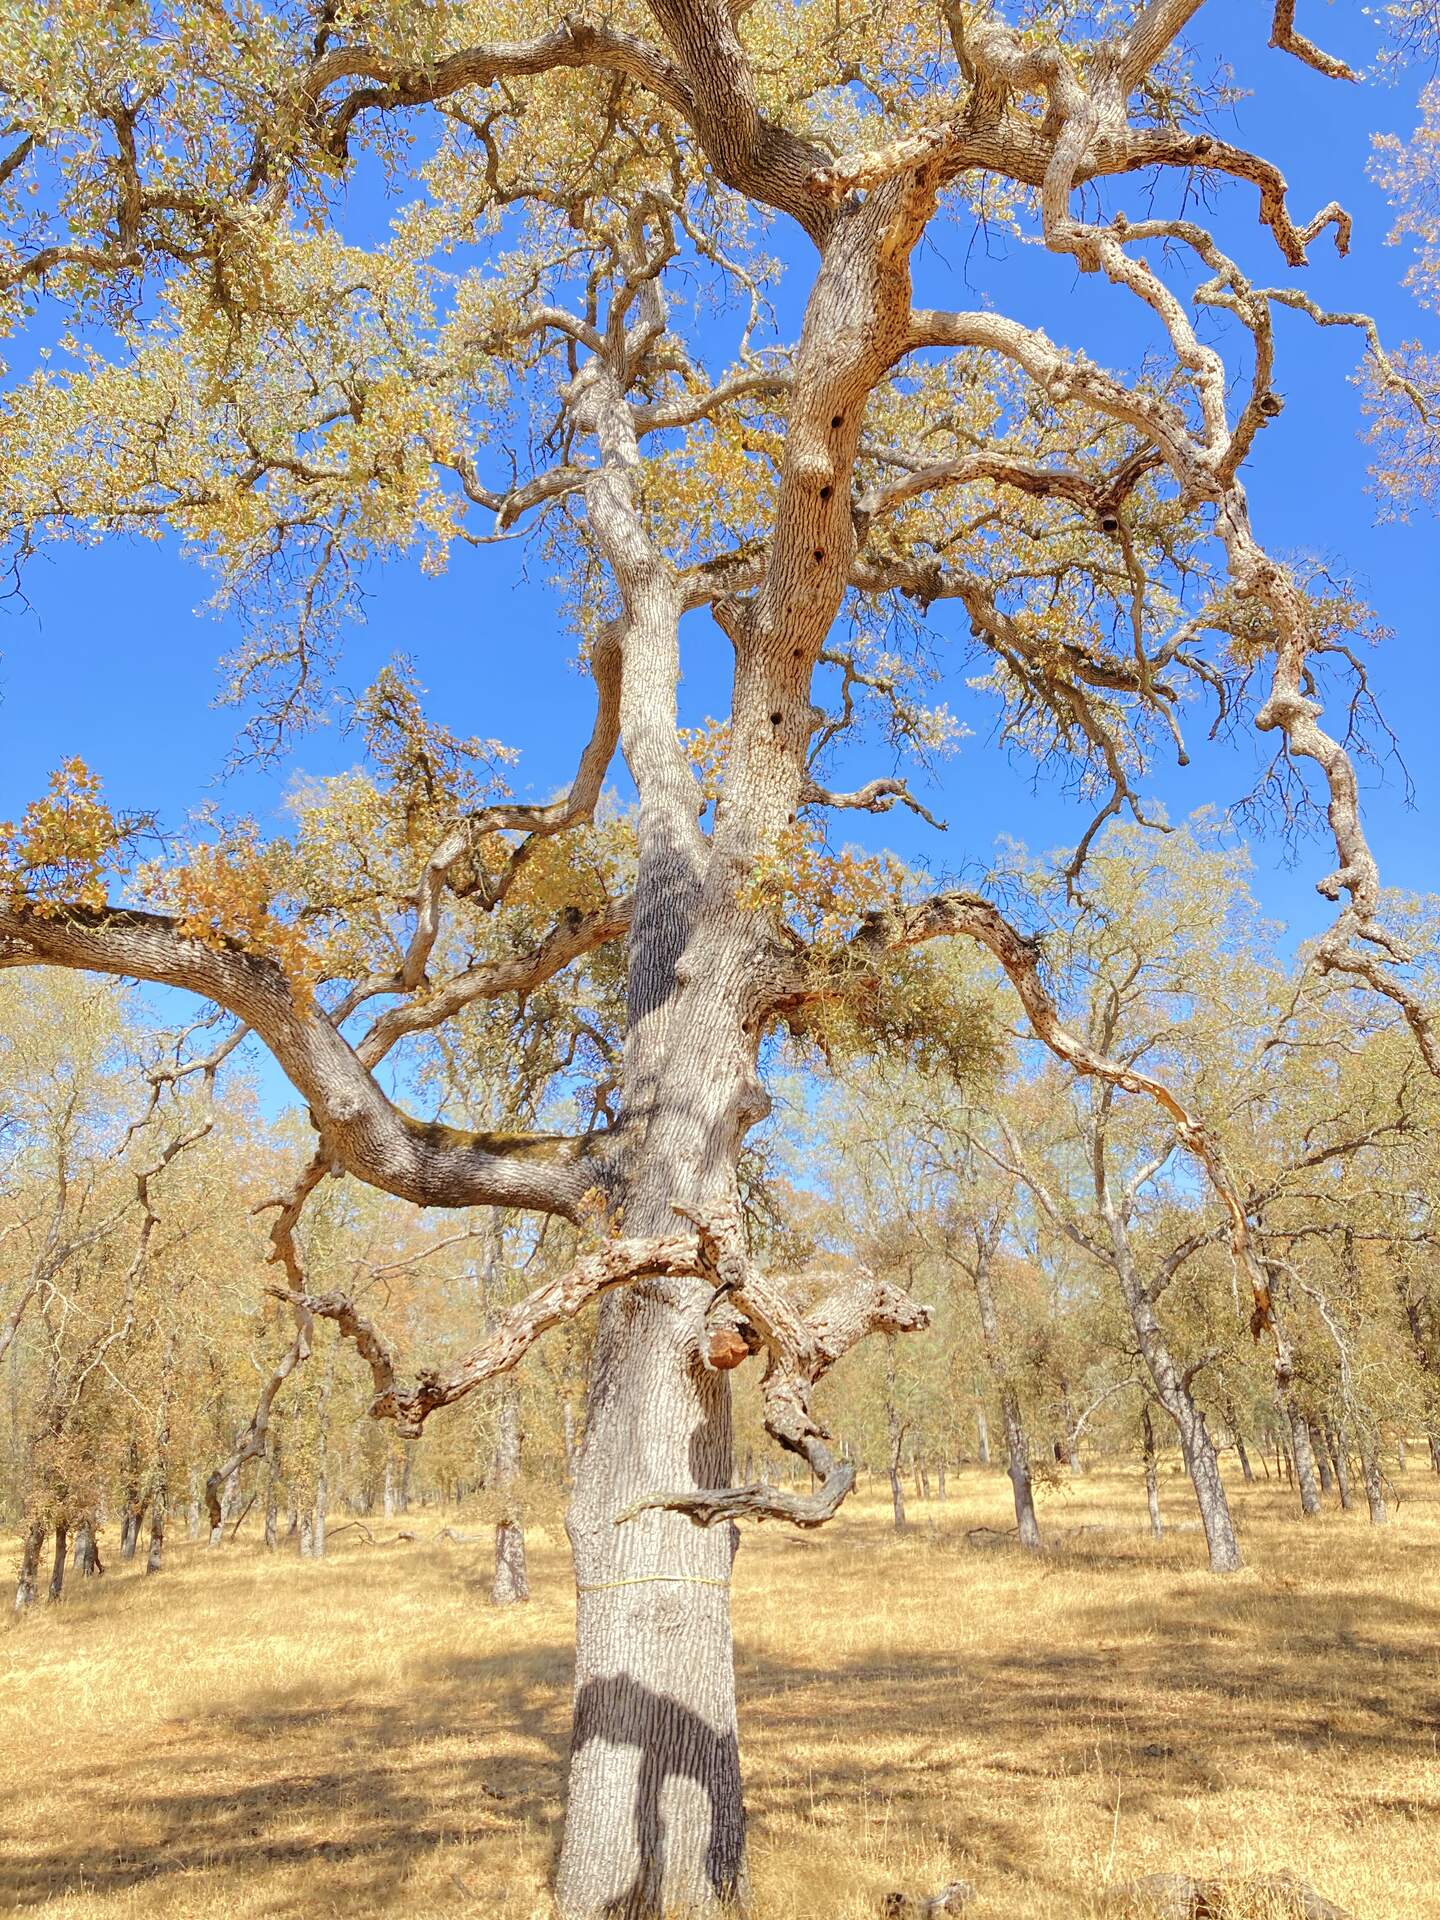
20220914TZ_WoodpeckerCondo.jpg ( 2022-09-14 14:39:02 ) Full size: 1440x1920
At least six woodpecker holes in this tree
16 sets found
No data found for TZ_Fenergy.
11 TZ_tmet graphs found
No data found for TZ_soilco2.
Can't check TZ_mixed
3 TZ_mixed graphs found
1 TZ_fflux graphs found
8 TZ_fmet graphs found
No data found for TZ_tram.
3 TZ_co2prof graphs found
1 TZ_irt graphs found
No data found for TZ_windprof.
1 TZ_tflux graphs found
8 TZ_sm graphs found
Can't check TZ_met
1 TZ_met graphs found
Can't check TZVR_mixed
8 TZ_osu graphs found
3 TZ_fd graphs found
Tonzi Z-cam data