
Field Notes
<--2022-08-04 11:00:00 | 2022-08-31 10:10:00-->Other sites visited today: Hill Slough | Bouldin Corn
Phenocam link: Searching...
Bouldin Alfalfa: 2022-08-15 12:25:00 (DOY 227)
Author: Joe Verfaillie
Others: Daphne, Koong
Summary: Hot, Field is brown/yellow, little growth after last cut, Landsat overpass survey, Attempt at Ameriflux soil samples, NDVI not reading, wiring mess, Three soil moisture samples
| Bouldin Alfalfa 2022-08-15 Daphne, Koong and I arrived at 12:15 PDT. It was clear and hot with hazy horizons and just a little breeze from the northeast. The field was mowed about 10 days ago and there were an unusually small number of bales on the field. A tractor picked some up while we were there. The field is still very brown/yellow with only a few sprouts from each root base. The sprouts are 10-15cm high but much more bare ground than plants (maybe 10% plant coverage?). There were irrigation ditches full of water up near the highway but the ditches here were dry. There was an excavator cleaning ditches upwind from our field. As soon as we arrived Daphne and Koong did the Landsat overpass IRT survey. I started taking soil samples for the Amerilfux soil water potential campaign but gave up after one profile. I chose a spot just northeast of the tower in line with the rows. The soil was very dry and crumbly and it was hard to get intact cores. I was able to dig down to -0.5m but it was almost impossible to get that core out. Could have been partly due to the heat and already having taken 12 cores at corn. I’ll talk to Kim Novick and Alex and re-evaluate. Daphne collected the flux, met, camera, FD, ADEX and Corteva IRT data. Koong cleaned the sensors. The NDVI channels weren’t reading. In trying to cycle the power on the NDVI sensors the wiring got confused and power to the AM16/32 was loose and intermittent for a while. Eventually it got straightened out, put back together and working. This box needs a wire clean up and new 12V power strip. The 7500 read: 394ppm CO2, 757mmol/m3 H2O, 33.6C, 100.9kPa, 96SS – 99 after cleaning. CO2 is low and H2O high due to dirty windows – probably better after cleaning. The eddy clock was adjusted by +1min. I cleaned the solar panels. Koong and Daphne took a soil sample by slide hammer for soil moisture. We arrived at the Bouncer tower at 14:10 PDT The 7500 read: 401ppm CO2, 630mmol/m3 H2O, 35.0C, 100.9kPa, 97SS – 99.7 after cleaning The eddy clock was adjusted from 13:22:00 to 13:22:40 (+40sec) and logging restarted. I cleaned the 7500 and the Rnet. We took a soil sample by slide hammer for soil moisture. We arrived at the Edge tower at 14:35 PDT The 7500 read: 395ppm CO2, 756mmol/m3 H2O, 37.3C, 100.8kPa, 99.4SS We did not clean the 7500 because the SS was so high, but probably should have because the CO2 was low and the H2O was high. Yes, the temp was 37C – the car said 107F. Koong cleaned the solar panels. I took a soil sample by slide hammer for soil moisture. I also did spectral measurements. The eddy clock was adjusted by +45sec and logging restarted. We left at about 14:50 PDT. |
Next Mowing: 2022-09-12
3 photos found
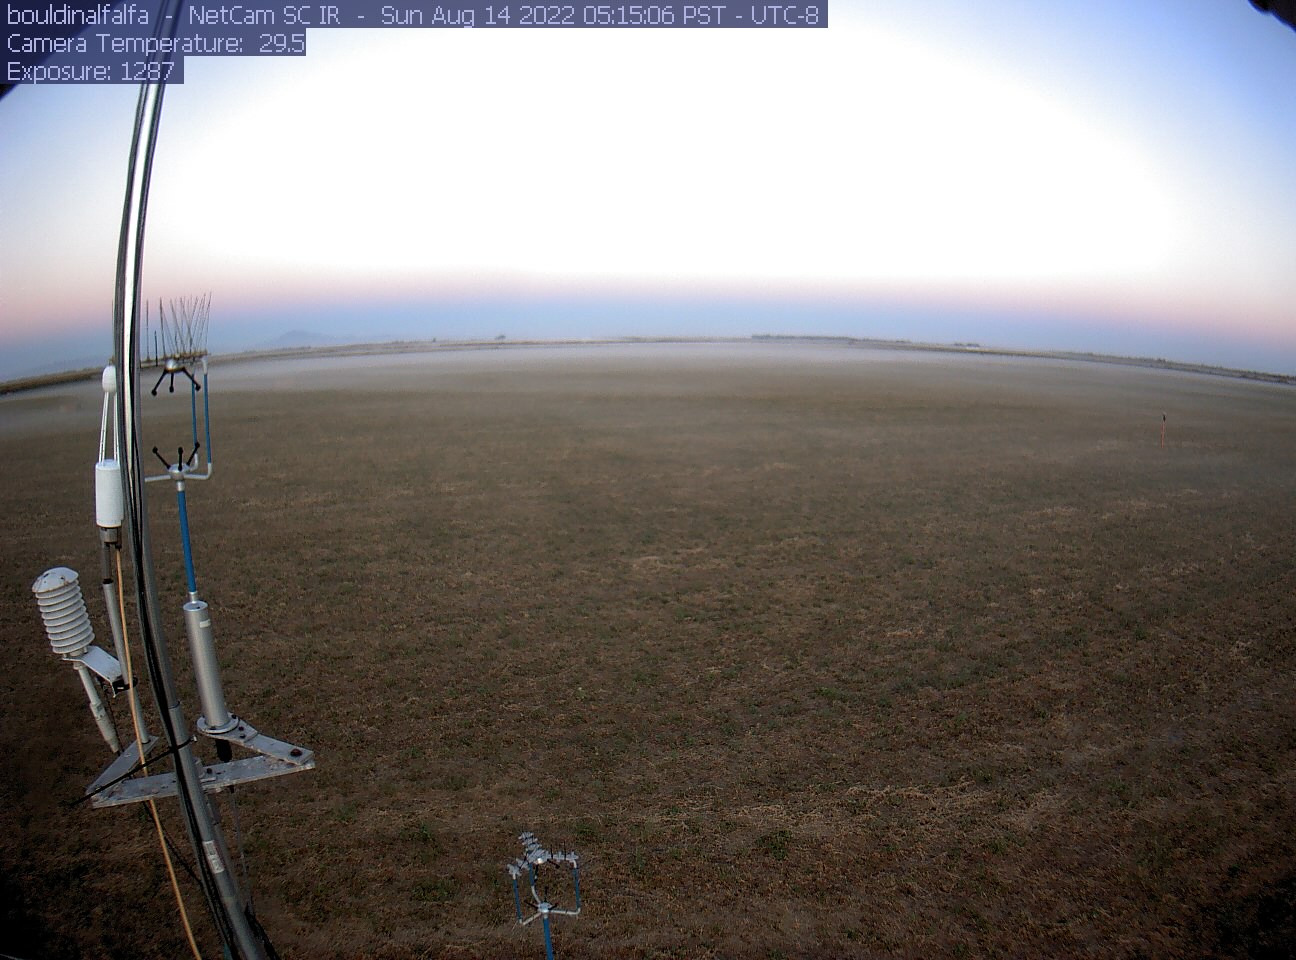
bouldinalfalfa_2022_08_14_051506.jpg ( 2022-08-14 06:17:02 ) Full size: 1296x960
Morning tule fog

bouldinalfalfa_2022_08_15_114505.jpg ( 2022-08-15 12:47:10 ) Full size: 1296x960
Joe sampling soil for Kim Novick's AMP soil properties campaign
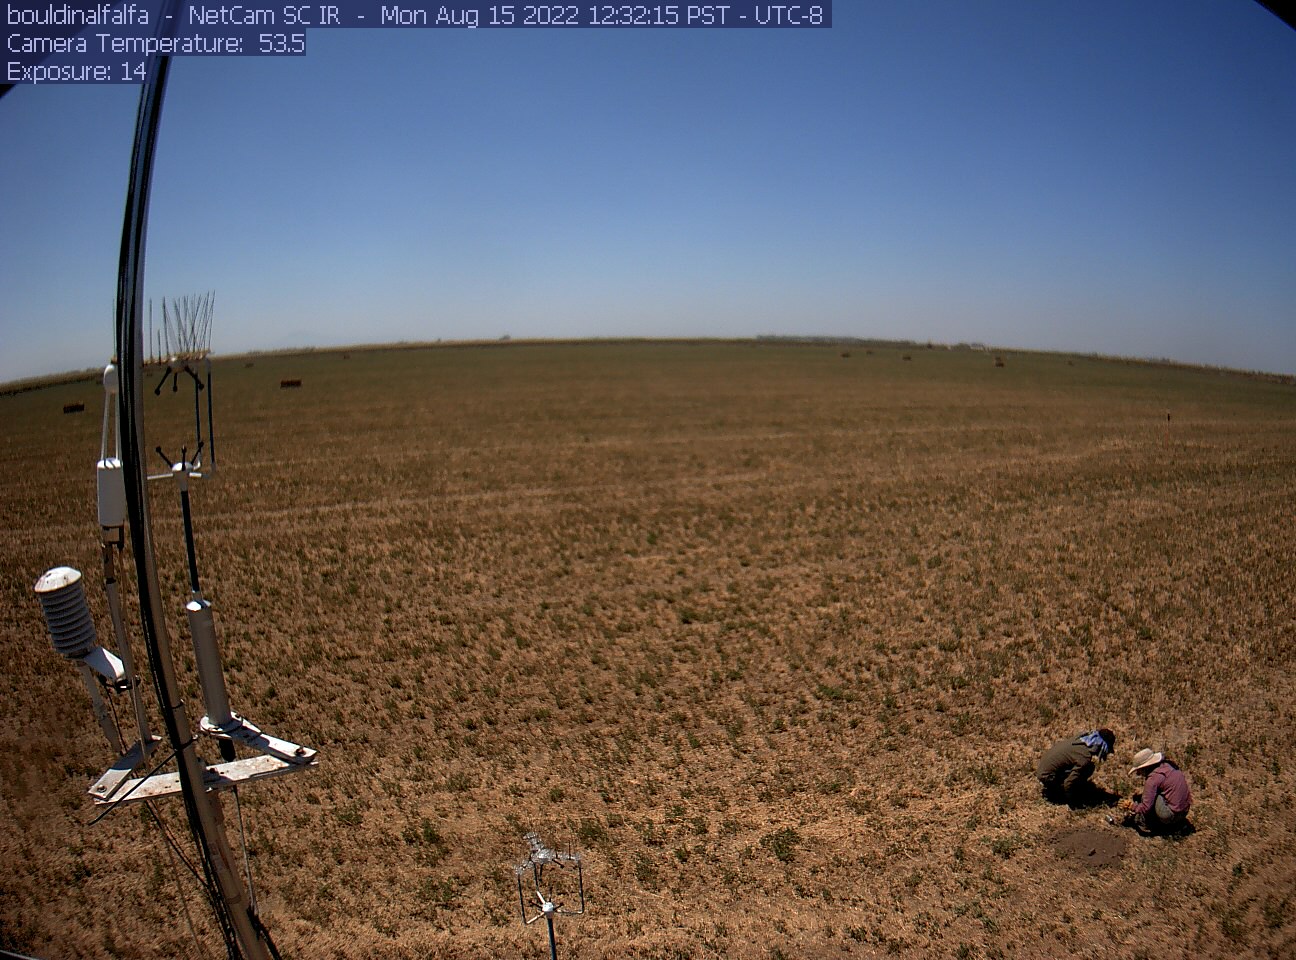
bouldinalfalfa_2022_08_15_123215.jpg ( 2022-08-15 13:34:26 ) Full size: 1296x960
Koong and Daphne sampling soils
7 sets found
4 BA_flux graphs found
21 BA_met graphs found
6 BA_arable graphs found
Can't check TATWBABCSB_cam
Can't check MBSWEEWPBCBA
2 BA_processed graphs found
11 BA_adex graphs found