
Field Notes
<--2022-07-14 11:20:00 | 2022-08-15 12:25:00-->Other sites visited today: Bouldin Corn | Hill Slough
Phenocam link: Searching...
Bouldin Alfalfa: 2022-08-04 11:00:00 (DOY 216)
Author: Daphne Szutu
Others: Carlos
Summary: Regular data collection/cleaning, our field will be mowed soon, trimmed alfalfa, spectral, veg height, 3 soil samples, reinstalled Hukseflux SHF plate at Bouncer tower, alfalfa around Bouncer/Edge towers is more yellow/dry,
| 2022-08-04 Bouldin Alfalfa Carlos and I arrived at 11:00 PDT. It was warm and mostly clear with scattered thin clouds and an occasional breeze. The alfalfa in our field and the field to our east was flowering but not very dense and only about knee height, so I initially thought it would be another week or so until they mow. I raised Carlos's hopes and declared that we didn't need to cut the alfalfa today. However, shortly after we arrived, a tractor started mowing the field to our east, so our field is probably next and we decided to trim alfalfa under the towers today. Main Tower No Landsat overpass today so Carlos got started with spectral and veg height measurements at the main tower. I downloaded met, cam, and USB GHG data. I downloaded the IRT data by swapping the microSD card and using CardConvert to convert the fast data to TOB1 and the slow data to TOA5. I downloaded the FD data and cleared its memory. I swapped the camera card and converted the10sec T/RH data to a TOB1 file. It looked fine. I swapped the Adex CR1K card and converted the data to TOB1. All the full-day files were the same size. I connected to the datalogger to download and check the 30min data—looked fine. I also checked through LoggerNet that the new card was mounted correctly. I changed the eddy clock +1:15min from 10:23:15 to 10:24:30 to match the laptop time. I restarted logging afterwards. Carlos cleaned flux and rad sensors. He removed the 7700 wash box and power cable to bring back to the lab for the urban tower. The wash tubing and the hose clamp + bolt for mounting are still on the tower. Back in the lab I realized we needed a longer power cable for the urban tower, so we couldn't use this factory-length power cable. We took one soil sample using the slide hammer. The core depth was 0-5cm. The soil felt dry but it was easy enough to pound the core in. The cores were leveled, capped with the blue plastic caps, and the caps were sealed to the core with electrical tape. I planned to weigh the “wet” weights in the lab the following day but forgot until Monday 2022-08-08. The soil is pretty dry so I don't think it will make a difference. We trimmed the alfalfa under the main tower and under the PL Arable. The 7500 read: 390ppm CO2, 730mmol/m3 H2O, 29.6C, 100.9kPa, 93SS – 99.7 after cleaning Bouncer Tower We got to the Bouncer Tower at 12:05 PDT. We trimmed the alfalfa under the tower and the solar panels, leaving a patch between the two that hopefully the mowers will get. Here and at the Edge tower, the alfalfa immediately around the tower and the solar panels is more yellow and has some dry leaves compared to the rest of the field. Carlos cleaned the solar panels, which had some organs/intestines stuck on, which made him gag for the 2nd time of the day. Carlos reinstalled Hukseflux SHF plate sn 003072 at -10cm. This cable was cut last time and I had spliced it back together in the lab. I wired the sensor into the CR23X and checked that its data looked reasonable. I added more split loom to all the exposed cables from 0-50cm above the ground, any height which might accidentally get cut along with alfalfa. I downloaded CR6 (30min, 10s, 20Hz), CR23X (30min), and USB GHG (20Hz) data. For the CR6 10s and 20Hz data, I swapped the microSD card and used CardConvert to convert to TOB1. The raw data are still on the removed microSD card for now (remove before next site visit). I checked the 30min data from the CR6 and CR23X and they seemed reasonable. I cleaned the 7500 and the Rnet sensor. There was some white bird poop on the edge of the Rnet sensor. I changed the eddy clock +50sec from 11:42:20 to 11:43:10. I restarted logging afterwards. Carlos also took 1 soil core sample using the slide hammer. The core depth was 0-5cm. The soil felt dry but it was easy enough to pound the core in. The 7500 read: 404ppm CO2, 580mmol/m3 H2O, 31.4C, 100.9kPa, 93SS – 99 after cleaning Edge Tower We got to the Edge Tower at 13:10 PDT. We double checked the level of the tower, which still looks fine after our adjustments last week. Carlos and I trimmed the alfalfa under the tower and solar panels. Hopefully the mowers will take care of the path between the two. Here and at the Bouncer tower, the alfalfa immediately around the tower and the solar panels is more yellow and has some dry leaves compared to the rest of the field. A tractor was collecting bales in the alfalfa field to our NW. Carlos took 1 soil core sample using the slide hammer. The core depth was 0-5cm. The soil felt dry but it was easy enough to pound the core in. I downloaded CR6 (30min, 10s, 20Hz), CR23X (30min), and USB GHG (20Hz) data. For the CR6 10s and 20Hz data, I swapped the microSD card and used CardConvert to convert to TOB1. The raw data are still on the removed microSD card for now (remove before next site visit). I checked the 30min data from the CR6 and CR23X and they seemed reasonable. Carlos cleaned the 7500, Rnet sensor, and solar panels. I added more split loom to all the exposed cables from 0-50cm above the ground, a height where they might accidentally get cut along with alfalfa. I changed the eddy clock +30sec from 12:42:00 to 12:42:30. I restarted logging afterwards. The 7500 read: 391ppm CO2, 757mmol/m3 H2O, 33.4C, 100.9kPa, 97SS -- 101 after cleaning We left at 14:05 PDT. |
Next Mowing: 2022-08-05
Veg Height (cm): Tape measure from ground to top of plant - Flowering, Mowing expected soon
60, 47, 43, 55, 57, 57, 54, 45, 47, 38, 52, 59, 56, 47, 39, avg = 50.4, stdev = 7.19
4 photos found
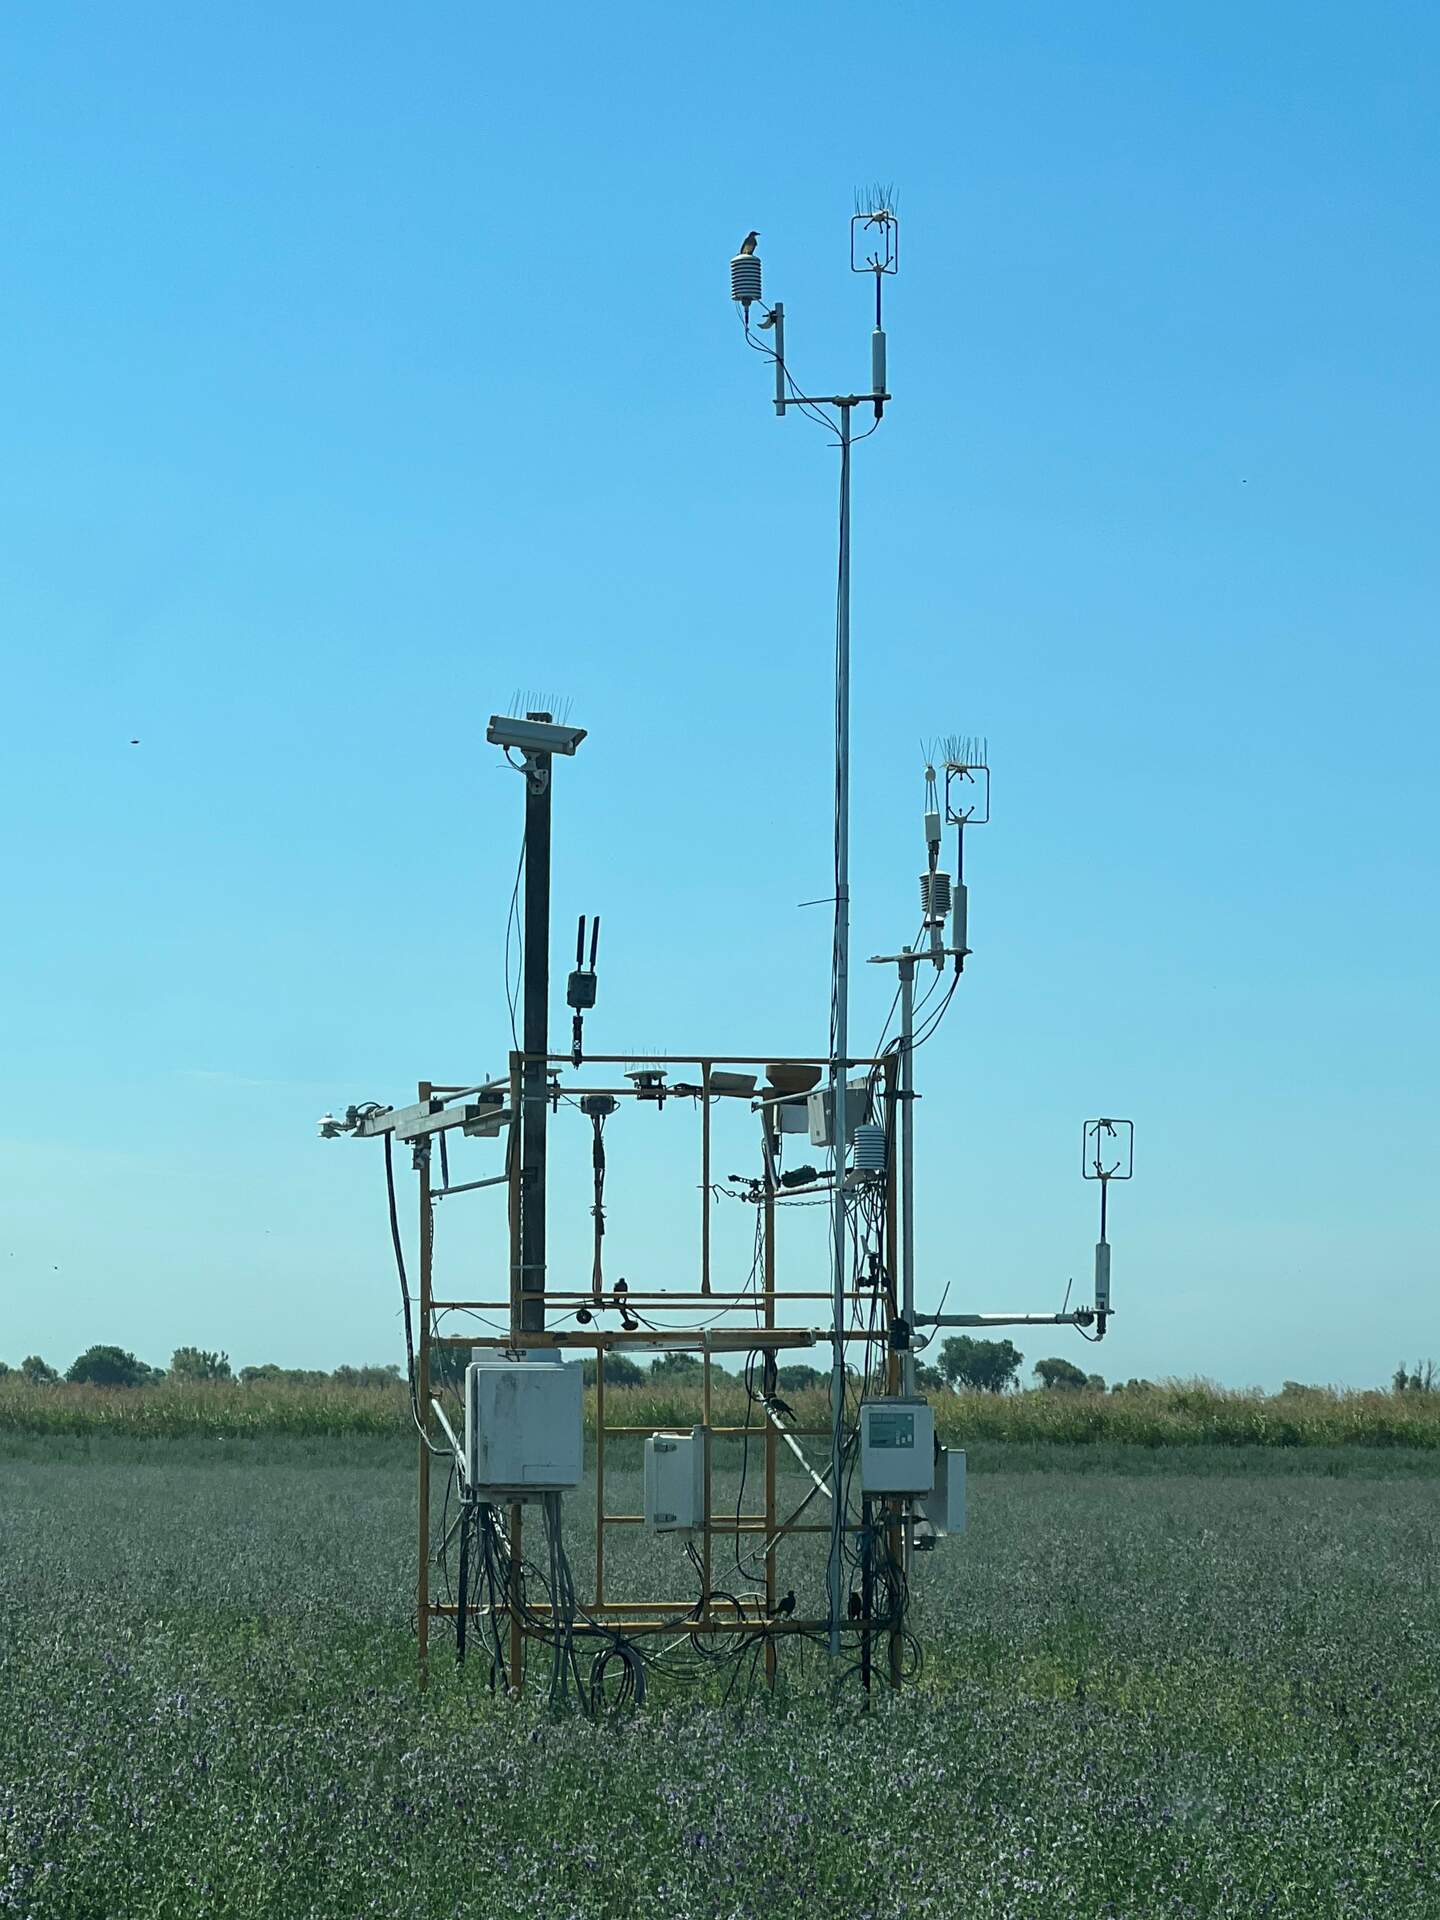
20220804BA_Birds.jpg ( 2022-08-04 11:03:31 ) Full size: 1440x1920
Starlings(?) on the tower as we drove up

bouldinalfalfa_2022_08_05_124506.jpg ( 2022-08-05 13:46:26 ) Full size: 1296x960
Starlings everywhere, blocking main and lower adex sonics
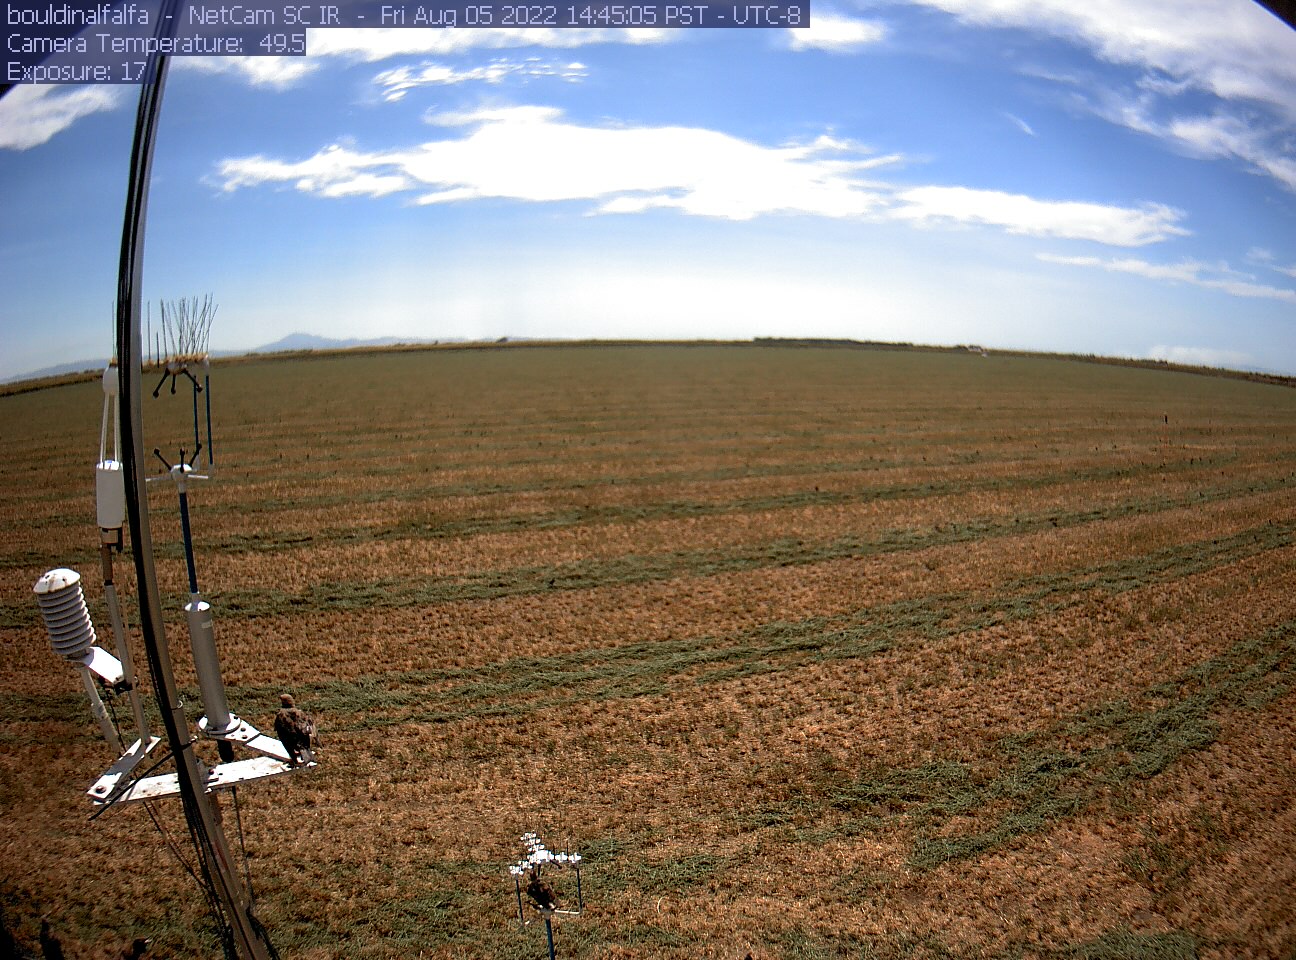
bouldinalfalfa_2022_08_05_144505.jpg ( 2022-08-05 15:46:28 ) Full size: 1296x960
More starlings, including blocking the lower adex sonic path
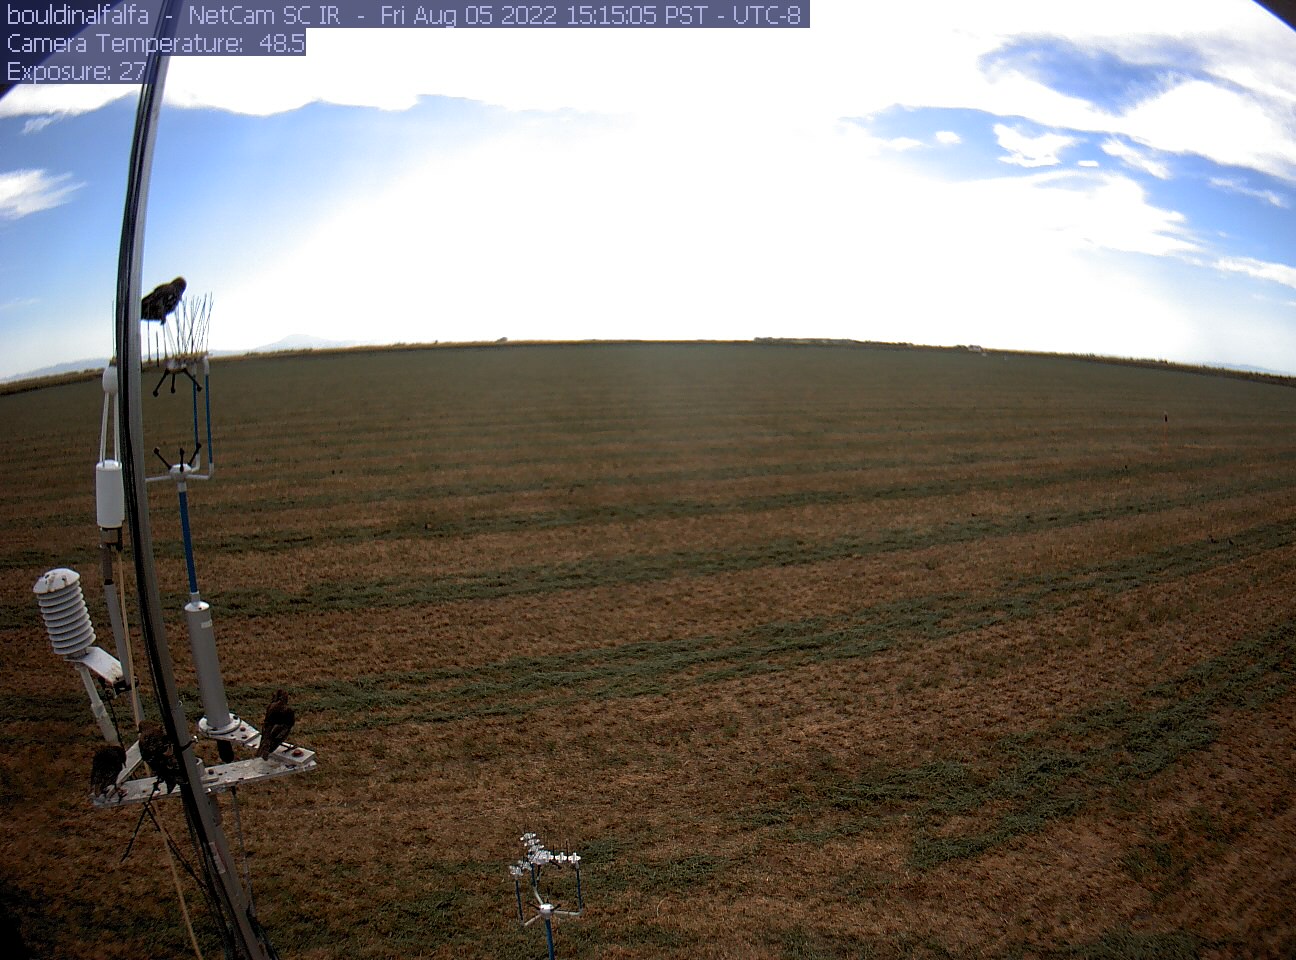
bouldinalfalfa_2022_08_05_151505.jpg ( 2022-08-05 16:16:26 ) Full size: 1296x960
Starlings
7 sets found
4 BA_flux graphs found
21 BA_met graphs found
6 BA_arable graphs found
Can't check TATWBABCSB_cam
Can't check MBSWEEWPBCBA
2 BA_processed graphs found
11 BA_adex graphs found