Field Notes
<--2022-07-14 08:40:00 | 2022-08-01 13:00:00-->Other sites visited today: Gilbert Tract | Hill Slough
Phenocam link: Searching...
Mayberry: 2022-07-26 10:00:00 (DOY 207)
Author: Carlos Wang
Others: Ariane
Summary: Troubleshooting sonic anemometer - sonic data frozen since 2022-06-17, removed sonic and brought back to the lab for further troubleshooting
| We arrived at Mayberry around 10 AM PDT, the weather was nice with some breeze. The main task at this site is to troubleshoot the sonic anemometer that had bad data for all channels. Bad data started on Friday, June 17, 2022 5:17:09 PM. Since then, U has been stuck at 3.03 m/s, V has been stuck at -1.53 m/s, W has been stuck at 1.03 m/s, and SOS has been stuck at 344.52. Multiple trips were made at this site. <<<<------- TRIP 1 ------->>>> The upper joint of the sonic connector, where the wires are encased, were loose. Visually the sonic had no damage. Then we disconnected the sonic cable, and all seemed fine (i.e. no corrosion and/or broken pins). Upon connecting to the Licor software, all sonic data was still -9999 [Note by Daphne 2022-08-02: this was because "U" was plotted instead of "7550 Auxiliary Input 1", etc. In any case, the sonic data was bad]. We checked the analog connection to the Licor box, cable and pins looked good visually. We then lowered the sensor pole after marking the original position, and removed the sonic to have a closer inspection at the lower level. Also tested the power on the power box, all terminals had 13V (power good). The sonic sn 153805 was taken in the car and its cable was secured on the tower. The sonic heading was 7 deg true N before we removed it. We also noticed the LI7700 had low RSSI and the AMP fan cable was loose, so we cleaned the sensor and reconnected the fan cable. <<<<------- TRIP 2 ------->>>> After consulting Joe, we needed a serial connector to check the sonic directly. Unfortunately, we couldn't find any serial connectors at EE and WP, so we had to go to HS retrieve the connector. Before going to HS, we stopped by Mayberry again to remove the cable and raised the pole to its original position. <<<<------- TRIP 3 ------->>>> HS has a serial connector, and we headed back to Mayberry. On the way, we stopped by to get donuts and coffee. We arrived at the site for the third time ~6 PM. When connecting and reading the sonic via the serial connector in "wind.exe", we were able to view the live 20Hz data. The configuration for U, V , W, SOS was correct. Additionally, data was also outputting ok (e.g. SOS 348). This helped us to figure out that the sonic anemometer was in fact still good and functioning. To conclude, we suspect the problem was from the analog cable. So we took down the cable and brought it back to the lab along with the sonic. We left the field around ~7:10 PM and got back to the lab ~ an hour later. |
3 photos found

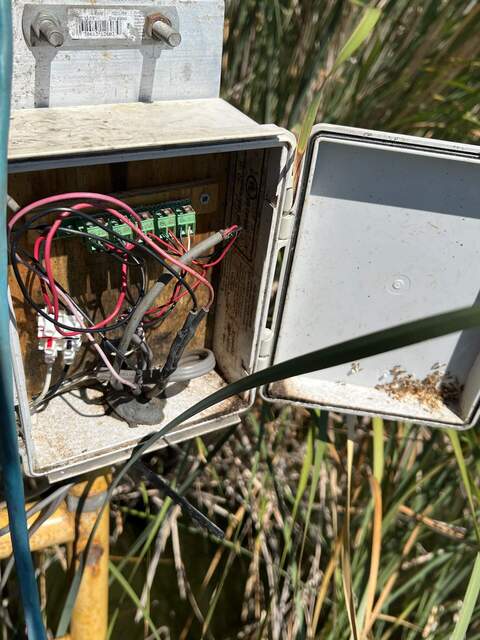
20220726MB_PowerBox.jpg ( 2022-07-26 10:49:00 ) Full size: 1440x1920
Power box at Mayberry. All looks ok.

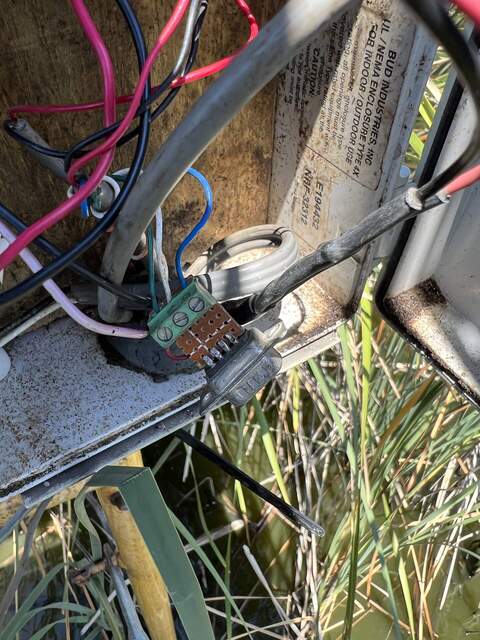
20220726MB_SonicSerial1.jpg ( 2022-07-26 12:21:53 ) Full size: 1440x1920
Initial serial connector found at Mayberry

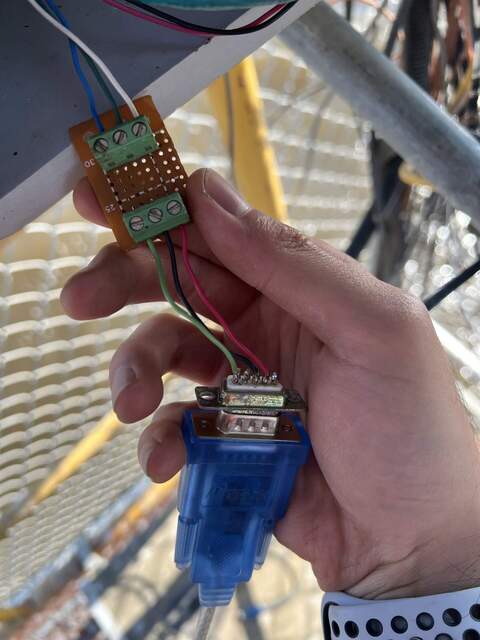
20220726MB_SonicSerial2.jpg ( 2022-07-26 17:05:03 ) Full size: 1440x1920
Sonic serial connector borrowed from Hill Slough
11 sets found
7 MB_flux graphs found
No data found for MB_met.
28 MB_tule graphs found
Can't check MBWPEESWGT_mixed
1 MB_cam graphs found
Can't check MBEEWPSWEPGT_cam
Can't check SIMBTWEE_met
1 MB_minidot graphs found
Can't check MBSWEEWPBCBA
1 MB_processed graphs found
Can't check MB_fd
1 MB_fd graphs found

