Field Notes
<--2022-07-13 09:45:00 | 2022-08-04 15:00:00-->Other sites visited today: Gilbert Tract | Mayberry
Phenocam link: Searching...
Hill Slough: 2022-07-26 16:00:00 (DOY 207)
Author: Ariane Arias-Ortiz
Others: Carlos
Summary: Changed EXO2 deployment configuration to fix the sonde's autonomous wiping (not wiping) and removed the silver 9-pin serial connector from the sonic cable
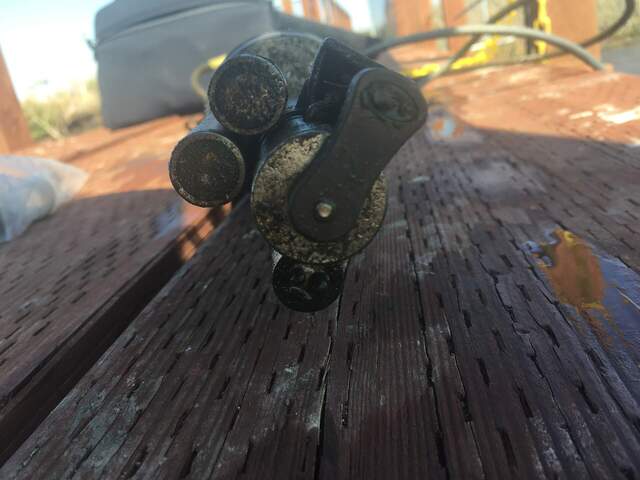
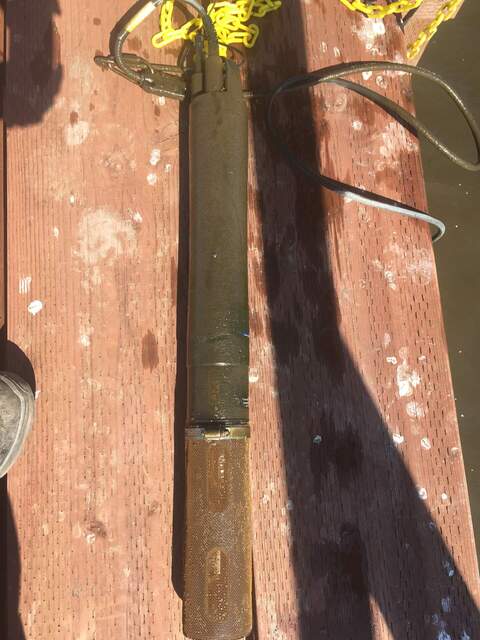
| Carlos and I arrived around 4:00 pm PDT. It was windy, and the tide was high, the channel edges were underwater, and the channel could not be distinguished from the rest of the marsh. The visit was to update the EXO2 deployment configuration and check whether a female serial connector was attached to the sonic cable. The EXO2 was deployed on July 13th, the deployment setting was set to sample every 10s, with an averaging window of 5 minutes. We realized that the EXO2 did not autonomously wipe the sensors with those settings. This is problematic because we expected a fair amount of biofouling that was confirmed when we retrieved the sonde. The sonde had been on the water for 2 weeks, and it was completely covered by algae/brown biofilm. The sensor guard had tiny arthropods inside, and we think the tiny critters had laid eggs on the copper mesh...(beautiful). I cleaned the sensor windows and chased the critters out of the sonde guard. EXO's tech support recommended using a sampling interval of at least 1.5 minutes for the wiping to occur. I changed the deployment to a 2 min sampling interval with no additional averaging window, plus a wiping event after every sample. We tested the latter settings before deploying the EXO in the water, and the autonomous wiping worked well. We imported and checked the data from the past two weeks and realized the sonde stopped collecting data on July 17th at around 10 pm. Five days after being deployed. We cannot find an apparent reason why this happened, there is a lot of free space on the internal disk. Carlos and Daphne will be out again next week, and will be good to check if the deployment is still active. The sonde battery was 62% after two weeks of deployment (with only five days of data collection at 10s intervals). We should keep an eye on the battery life, particularly now that a wiping event will happen every 2 min. I will ask McKenna about the settings they have at Dutch Slough, I don't think they are changing batteries every month and a half. After completing the EXO2 deployment updates, we checked whether a 9-pin female serial connector with green three screw terminals was attached to the sonic cable. We found one and took it to talk to the sonic at MB, which has been giving -9999 values in all channels since June 17th. We left at around 5 pm |
3 photos found

20220726HS_EXO_close.jpg ( 2022-07-26 16:08:02 ) Full size: 1920x1440
photo of the EXO2's sensors after two weeks of deployment without

20220726HS_EXO_fouling.jpg ( 2022-07-26 16:06:21 ) Full size: 1440x1920
EXO completely covered in algae/biofilm after it was deployed in the Hill Slough channel for only 2 weeks

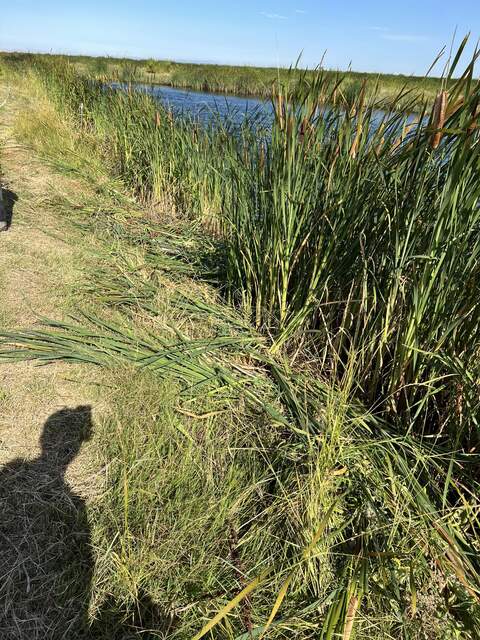
20220726HS_TrimmedVeg.jpg ( 2022-07-26 09:23:02 ) Full size: 1440x1920
Some of the channel-side veg was trimmed
4 sets found
21 HS_met graphs found
4 HS_flux graphs found
1 HS_cam graphs found
Can't check HS_Processed
2 HS_Processed graphs found

