
Field Notes
<--2022-06-09 08:15:00 | 2022-07-13 17:50:00-->Other sites visited today: West Pond | East End
Phenocam link: Searching...
Gilbert Tract: 2022-06-30 12:30:00 (DOY 181)
Author: Robert Shortt
Others: Pranjal, Marceau
Summary: Basic Data Collection + Soil Sampling at EE, WP, and GT
| We arrived at Dutch Slough at ~12:30 PDT. The weather remained clear, and while warm did not reach extreme temperatures, even at midday. There wasn't much haze, and you could see mount diablo clearly in the distance. Pranjal and Marceau went to take soil samples. Pranjal and Marceau were both very satisfied with the quality of their soil cores, Ari's piston helped immensely. Robert downloaded met/flux data and synched the logger and laptop times, which were 9 sec apart. The water reservoir was 80% full, and was topped off. 7500 SS: 98 --> 98 7700 RSSI: 50 --> 76 CO2: 400 H2O:680 CH4: 2.07 airT: 22.5C Pressure:101.5 kPa Water level = 31cm No issues with Camera, Met, and Flux data collection. We left around 1:30pm PDT. Note by Daphne: There were was synchronized spikes in AirT, RH, AtmP. Check datalogger/mux wiring next time. Ari has also mentioned issues with RH maxing out over the winter. The HMP45 should be replaced by our spare HMP155 in November when we finish the BA advection experiment and get the spare HMP155 back from the Bouncer tower. |
1 photos found
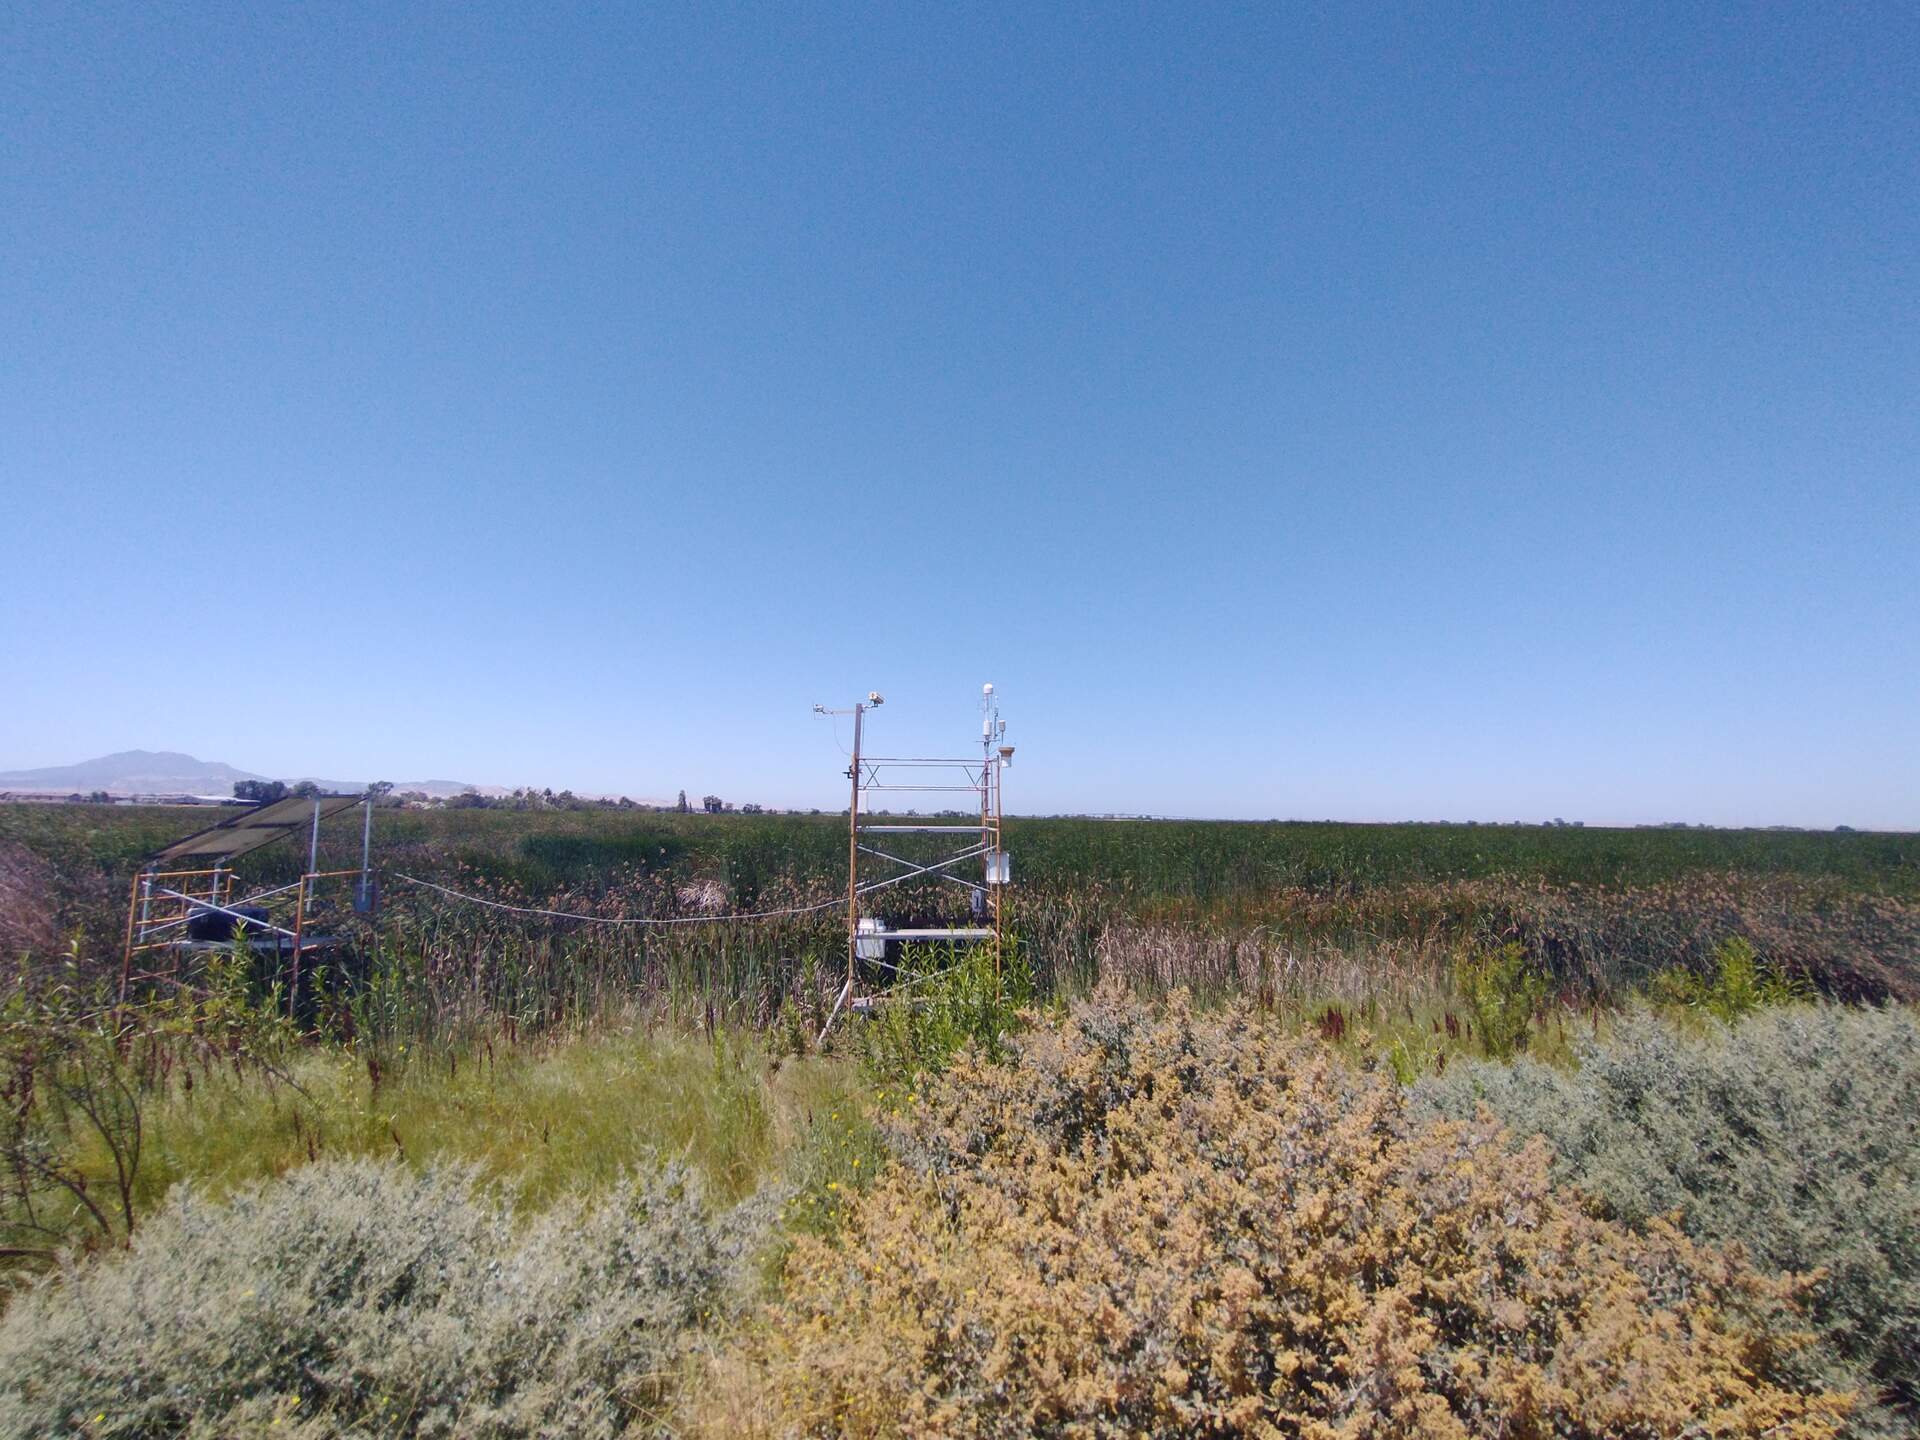
20220630GT_Site.jpg ( 2022-06-30 12:29:02 ) Full size: 1920x1440
Site visit
8 sets found
Can't check MBWPEESWGT_mixed
Can't check MBEEWPSWEPGT_cam
16 GT_met graphs found
4 GT_flux graphs found
3 GT_adcp graphs found
1 GT_cam graphs found
2 GT_usgs graphs found
2 GT_chanexo graphs found