
Field Notes
<--2022-06-09 10:55:00 | 2022-07-13 15:40:00-->Other sites visited today: East End | Gilbert Tract
Phenocam link: Searching...
West Pond: 2022-06-30 09:10:00 (DOY 181)
Author: Robert Shortt
Others: Pranjal, Marceau
Summary: Basic Data Collection + Soil Sampling at EE, WP, and GT.
| We arrived at West Pond at ~9:10am. The willows have gotten very tall, and some tree trimmers had been there recently leaving branches all around on the interior road. The water valve right by the entry gate had a large leak in it, and the wetland water level is much higher than this time last year. The weather was cloudless and mild, with lots of bird activity. Pranjal and Marceau went to take soil samples. I could not find the boardwalk in the undergrowth, so they went up the road a bit and waded into the tower footprint. Robert downloaded met/flux data and synched the logger and laptop times, which were 9 sec apart. the water reservoir was still 100% full. 7500 SS: 100.7 --> 101.4 7700 RSSI: 77 --> 83 Water level = 90cm The camera had no pictures in its memory card, most likely because it hadn't been turned back on after last collection 3 weeks prior, so no pictures. Robert replaced the memory card and set the camera to the "COUNTDOWN" position. If it continues to lose data there might be an issue with the camera. We left ~ 10:30am |
1 photos found
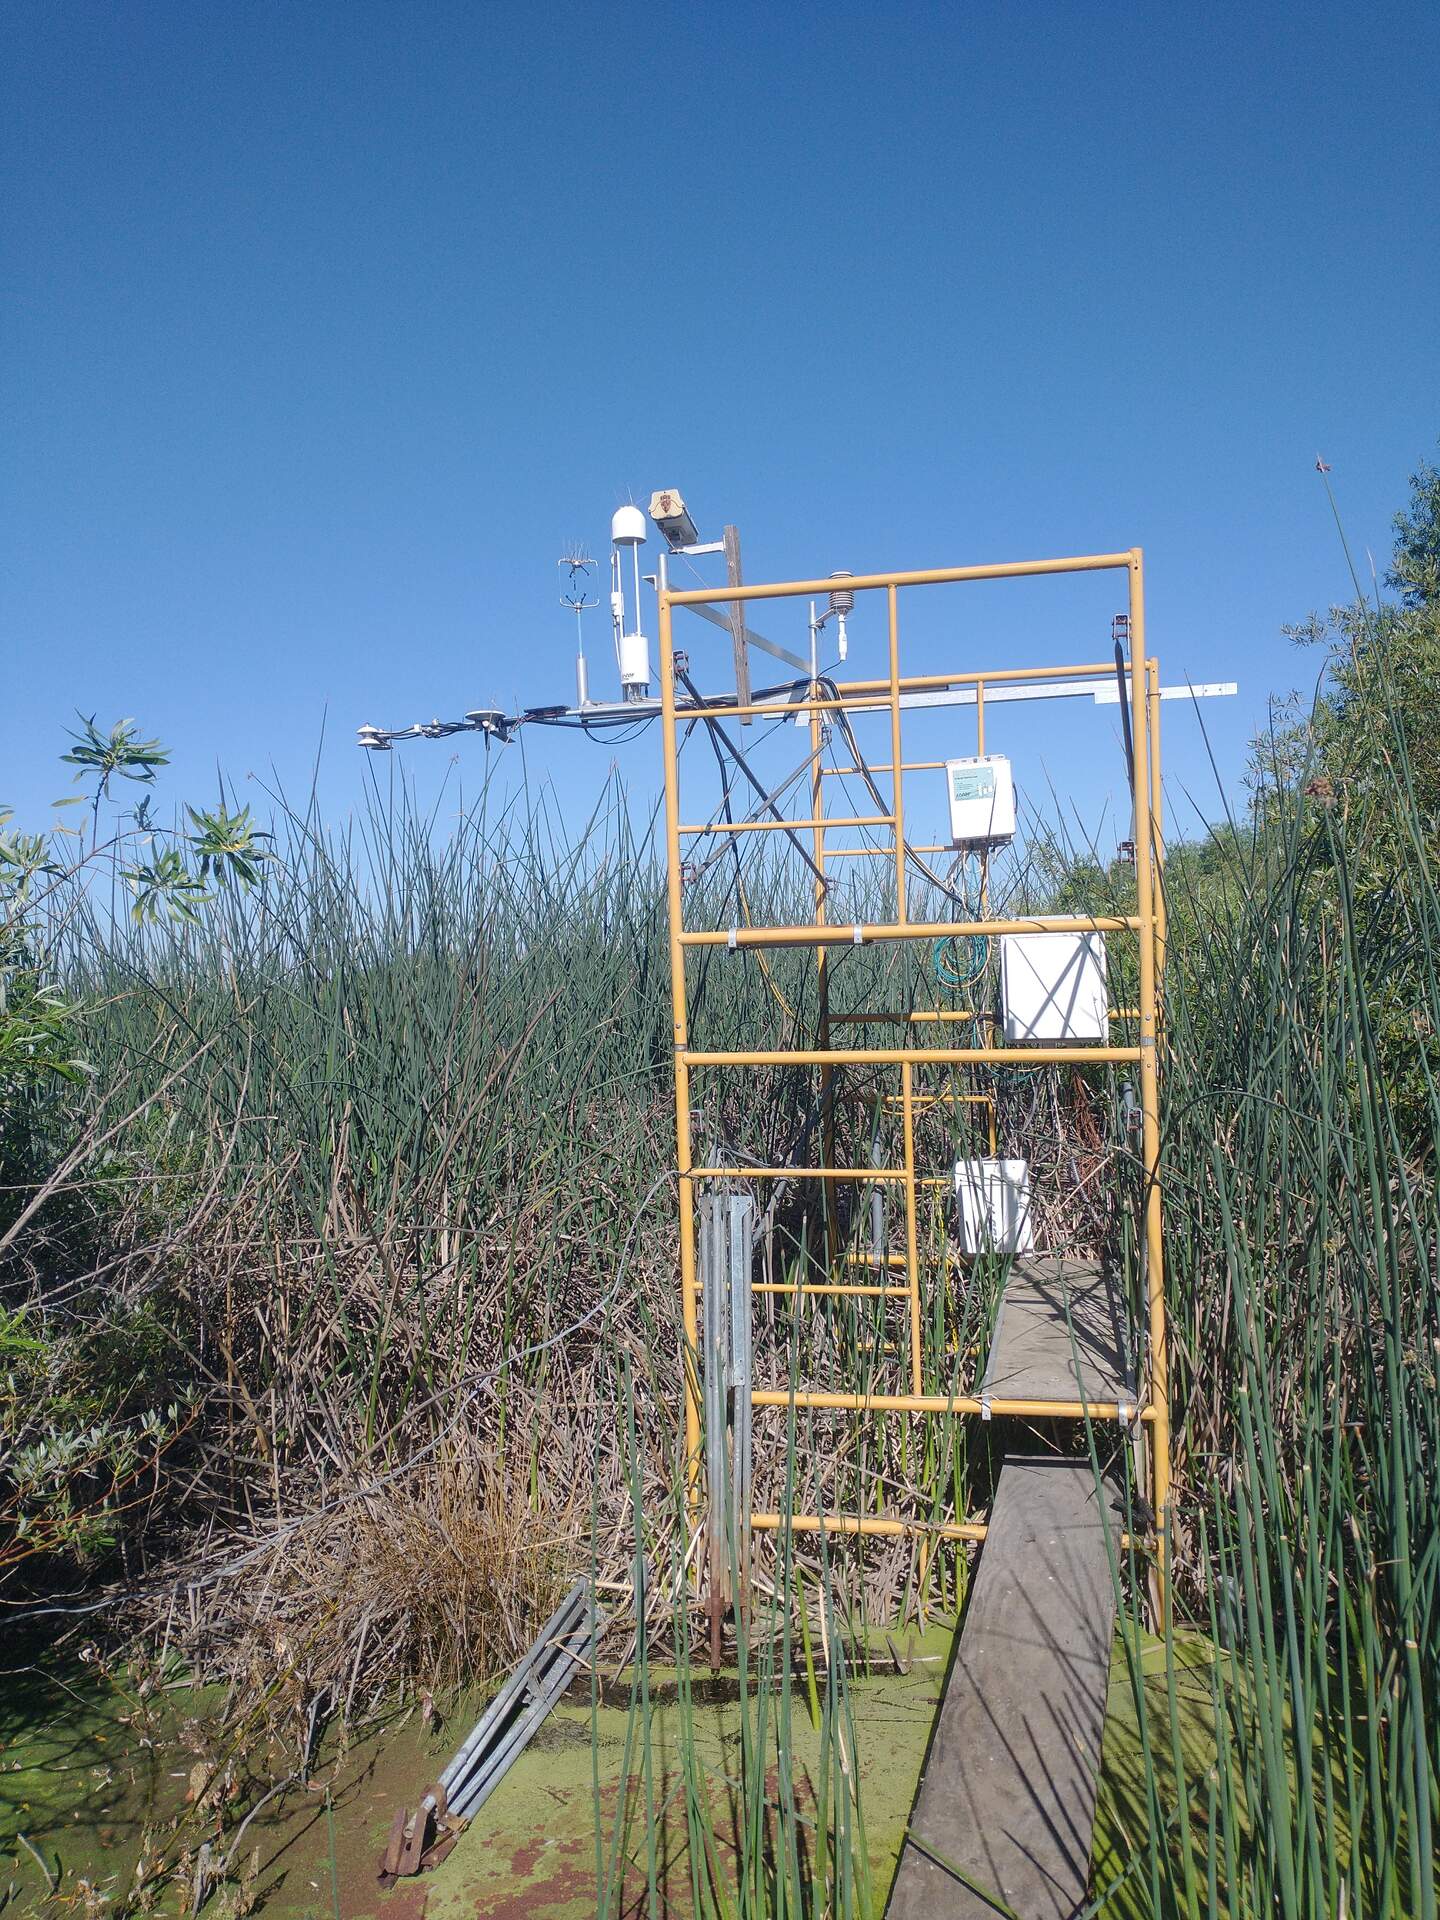
20220630WP_Tower.jpg ( 2022-06-30 09:12:02 ) Full size: 1440x1920
Higher water level, happy green plants
8 sets found
Can't check WP_DO
1 WP_DO graphs found
14 WP_met graphs found
5 WP_flux graphs found
Can't check MBWPEESWGT_mixed
Can't check MBEEWPSWEPGT_cam
Can't check MBSWEEWPBCBA
1 WP_processed graphs found
4 WP_arable graphs found