Field Notes
<--2022-04-13 12:35:00 | 2022-05-12 14:15:00-->Other sites visited today: Hill Slough | Mayberry | Gilbert Tract
Phenocam link: Searching...
West Pond: 2022-04-20 11:30:00 (DOY 110)
Author: Daphne Szutu
Others: Joe
Summary: Quick stop to replace LI-7700, replace top boardwalk, lots of water at the tower
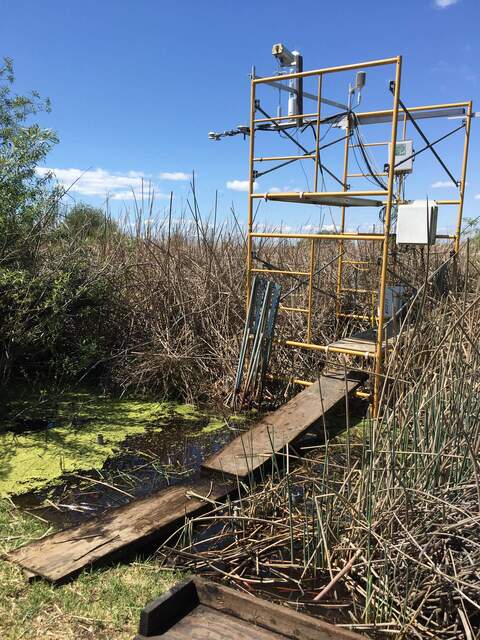
| 2022-04-20 West Pond Joe and I arrived at 11:30 PDT. On our way over from HS, we had to wait about 15 minutes for the Rio Vista bridge to come back down. It was mild and mostly sunny with an assortment of clouds in the sky. It's forecast to rain 0.5cm tonight into tomorrow. The water level was high! Joe rearranged some of the surplus lumber to make a bridge from the levee road to the tower. This was a quick visit to install a replacement LI-7700. We had to remove the 7700 and power cable last week because of power issues (the fuse had blown after water leaked inside). We installed 7700 sn TG1-0155 with a power cable, both removed from BA last week. I connected the 7700 in the 7550 interface, changed the eddy clock +15sec to match the laptop time, and restarted USB logging. We also replaced the plywood on the top boardwalk. The bottom boardwalk may need new plywood soon too. I downloaded met, cam, and USB GHG data. The water was pretty much full so I did not refill it. Watch out for the wasps in the reservoir box. We cleaned flux and rad sensors. LI-7500 readings: CO2 415ppm H2O 467ppm T 20.4C P 101.5kPa SS 100 after cleaning LI7700 readings: CH4 2.0 ppm RSSI 79 after cleaning We left around 12:00 PDT. |
1 photos found

20220420WP_Bridge.jpg ( 2022-04-20 12:11:10 ) Full size: 1440x1920
Joe's bridge over high waters
8 sets found
Can't check WP_DO
1 WP_DO graphs found
14 WP_met graphs found
5 WP_flux graphs found
Can't check MBWPEESWGT_mixed
Can't check MBEEWPSWEPGT_cam
Can't check MBSWEEWPBCBA
1 WP_processed graphs found
4 WP_arable graphs found

