Field Notes
<--2010-10-14 09:30:00 | 2010-10-31 15:00:00-->Other sites visited today: Sherman Island | Mayberry
Phenocam link: Searching...
Twitchell Rice: 2010-10-27 08:30:00 (DOY 300)
Author: Joe Verfaillie
Others: Jaclyn, Dennis
Summary: Pulled field sensors, power down due to GFI fixed.
| Twitchell
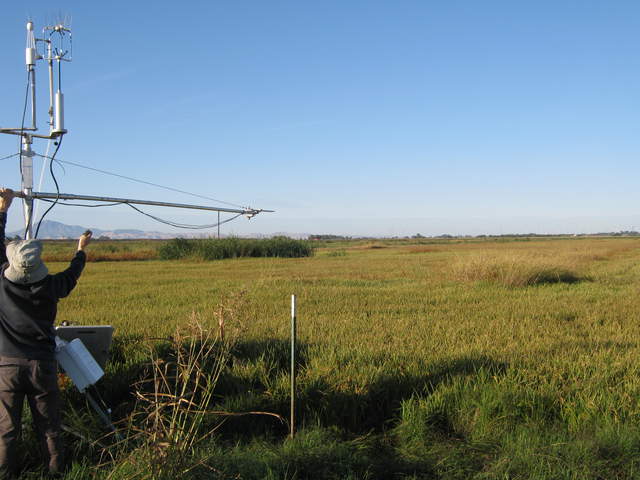
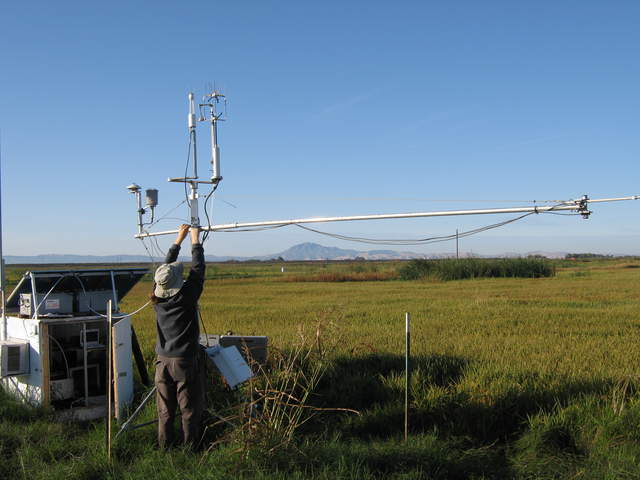
10/27/2010 I arrived about 8:30am with Jaclyn and Dennis. It was clear and cold with a little frost on the grass and heavy dew. The ground is wet from heavy rain over the weekend. Almost no wind – only a faint puff from the north-northeast. Harvest is progressing with fields to the west having been harvested and the north end of our field. We pulled all the field sensors: soil temp, SHF, Theta probe and well. I also rotated the radiation boom to the north over the edge of the field. I cleaned the radiometers. We brought in the water pressure sensor for calibration. Its wiring was: G = Blu/Yel/Shd C5 = Wht 12V = Red G = Blk No power at the site when we arrived. The GFI outlet on the generator had popped. I reset it and all was well. LGR was down for about three days but the rest continued on batteries. LGR reporting: 7:58PST, 6.02C, 144.05Torr, 16.050usec, 10Hz, 2.021ppm I collected data and swapped cards. |
2 photos found

20101027TW_Field.jpg ( 2010-10-27 09:02:19 ) Full size: 3648x2736
Maintaining the rice eddy tower

20101027TW_JoeSite.jpg ( 2010-10-27 09:02:43 ) Full size: 3648x2736
Joe working on the rice tower
6 sets found
12 TW_met graphs found
5 TW_flux graphs found
Can't check TWSI_mixed
Can't check SIMBTWEE_met
No data found for TW_cam.
Can't check TATWBABCSB_cam

