
Field Notes
<--2021-09-09 08:20:00 | 2021-09-20 09:00:00-->Other sites visited today: Mayberry | Bouldin Corn | Bouldin Alfalfa
Phenocam link: Searching...
Gilbert Tract: 2021-09-15 15:10:00 (DOY 258)
Author: Daphne Szutu
Others: Joe
Summary: Downloaded data, Hazy skies, Wired eosGP, Replaced HMP fan, Swapped 7500 for calibration, Installed rad cal kit, Installed precip bucket, Changed phenocam filenames
| 2021-09-15 Gilbert Tract Joe and I arrived at 15:10 PDT. It was sunny and warm, but breezy once you climbed above the canopy. The horizons were hazy, with Mt. Diablo only slightly visible. Joe checked the battery voltages, which seemed ok. He turned on the Low Voltage Disconnect setting (I think) on the solar charge controller. He used silicone and window mesh to seal holes in the solar controller box. I downloaded met and USB GHG data. Joe spliced the eosGP cable and I wired it to mux channels 13/14. I removed the white 7700 wash tubing and replaced it with black tubing that should be UV resistant. The HMP fan was not working, so Joe put in a fresh 24V fan. The 7700 RSSI was low so I cleaned it. We installed precip bucket sn 65552-615 on the northeast corner of the scaffolding. We had cleaned up and adjusted this bucket in the lab so it read 52 tips when 240ml of water were dripped through in about 20 minutes. I swapped the 7500A for calibration: sn 0041 came down and sn 0065 went up. I uploaded a new configuration file and updated the pressure coefficients. There was a 7700 clock sync error. I changed the eddy clock +30sec to match the laptop time. I reset the 7550 box and all seemed well. There were a lot of dead ants and a few live ants in the datalogger enclosure—I had left the main cable entry open so that the ants could escape from the smell, so I was surprised that the ants had stayed and died in the box. I wanted to plug up the main cable entry with duct putty, but Joe didn’t believe that would be any amount effective against the ants. In the end we left more mothballs in there to try to keep them away. Joe installed the Arable sn A001911 and the rad cal kit on the radiometer boom. Sensors added: CR1000 sn 23865 CNR4 sn 121038 PAR sn 060831 NDVI in sn 1049 NDVI out sn 1050 I used StarDot tools to change 2 config files: ftp.scr and IR_ftp.scr. I changed the filename for the photo files from “siwetland_...†to “gilberttract_...†so photos taken after today should have the correct file name. LI-7500 readings (sn 0041 --> sn 0065): CO2 402ppm --> 405 H2O 720ppm --> 664 T 26.3C --> 26.7 P 100.8kPa --> 101.2 SS 99--> 101 after cleaning LI7700 readings: CH4 3.0ppm --> 2.0 after cleaning RSSI 2--> 88 after cleaning We still need to think about where to put the staff gauge—it needs to be far enough into the wetland to be useful across most of the tidal cycle, close enough to read, and accessible enough to clean. Joe suggested at the outflow point by the future ADCP. We left at 17:00 PDT. |
1 photos found
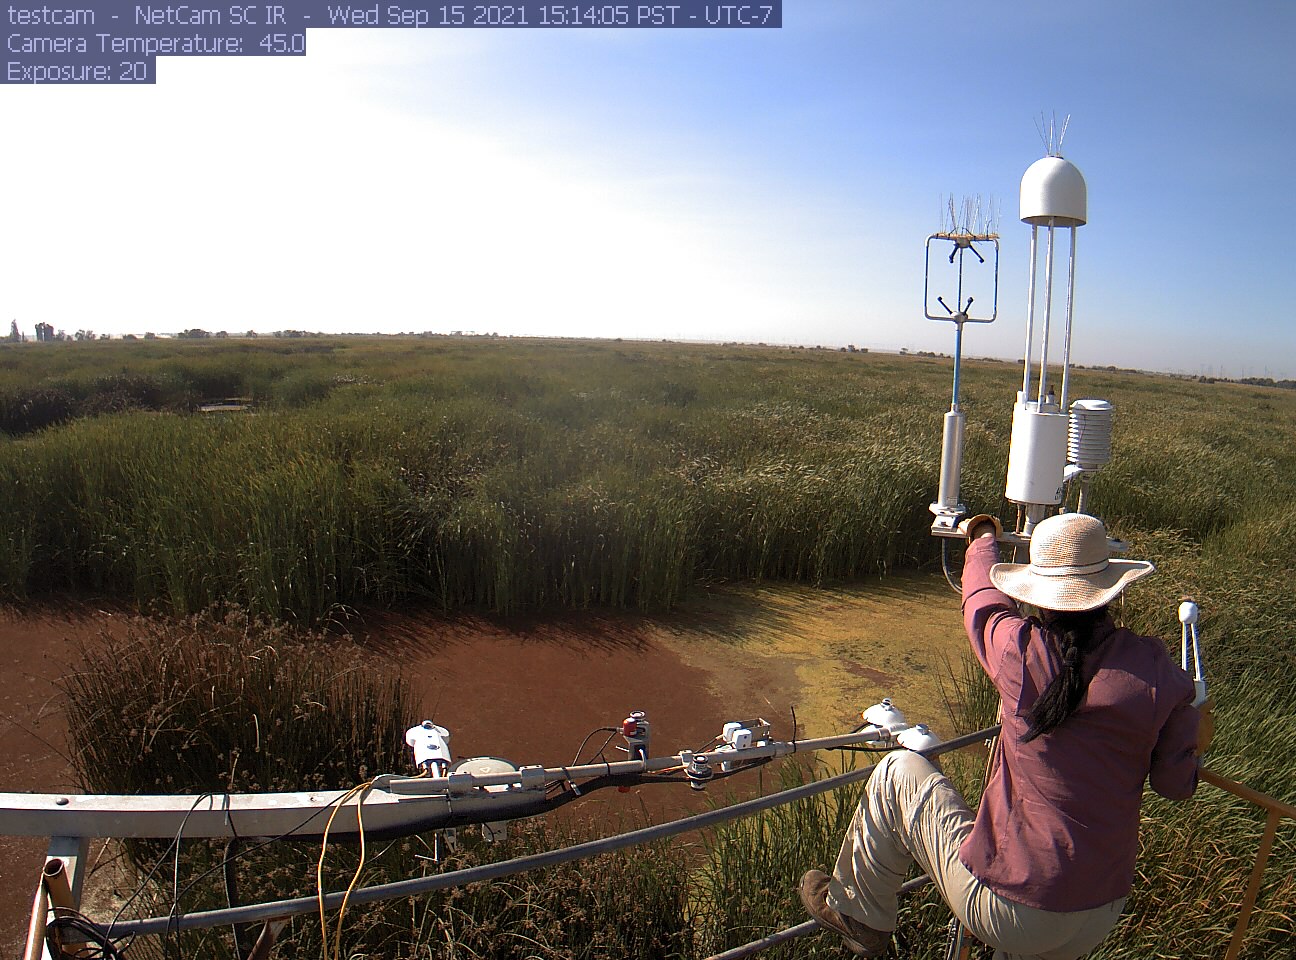
gilberttract_2021_09_15_151405.jpg ( 2021-09-15 15:15:34 ) Full size: 1296x960
Daphne swapping 7500s
8 sets found
Can't check MBWPEESWGT_mixed
Can't check MBEEWPSWEPGT_cam
16 GT_met graphs found
4 GT_flux graphs found
No data found for GT_adcp.
1 GT_cam graphs found
2 GT_usgs graphs found
2 GT_chanexo graphs found