Field Notes
<--2021-08-17 07:20:00 | 2021-09-03 09:00:00-->Other sites visited today: Bouldin Corn | Bouldin Alfalfa | West Pond
Phenocam link: Searching...
Hill Slough: 2021-08-25 09:30:00 (DOY 237)
Author: Daphne Szutu
Others: Joe
Summary: Fixed thermocouples, swapped dfPAR sensor, changed eddy clock +3min
| 2021-08-25 Hill Slough Joe and I arrived at 9:30 PDT. It was cold and windy with a layer of fog sitting over the hills to the west. There are fence posts and some reflectors up all along both sides of Grizzly Island Road. We parked across the street and walked in. This was a maintenace trip, mainly to fix some thermocouples that have been NAN or giving sporadic data. We also wanted to fix the diffuse PAR that stopped giving data earlier this month. Last week during a quick thermocouple inspection we found 2 thermocouples that did not have any soldering on them, so today we had planned to unwrap every thermocouple to check their soldering. However, the first few thermocouples that Joe checked on Profile A were all fine: +30cm (TC1), +15cm (TC2), -8cm (TC6), -16cm (TC7), -32cm (TC8). To these thermocouples Joe added some heatshrink with adhesive inside and rewrapped them in electrical tape. We decided to just check the ones that were giving bad data instead of unwrapping all the thermocouples. The following thermocouples were bad, so Joe added solder and adhesive heatshrink to them: Profile B, +32cm (TC9) Profile C, -4cm (TC21) Profile C, -8cm (TC22) The dfPAR was still not working consistently. I connected to the CR10x to check its data, and the PAR data (fastPAR) were all really low values close to 0. We changed the PAR sensor, which fixed the problem. For the dfPAR setup, we removed sn Q100420 and installed sn Q100421. I downloaded met, cam, and USB GHG data. I skipped the FD data since we’ll get those next week with our regular data download trip. I cleaned the rad and flux and topped off the wash reservoir. I changed the eddy clock from 9:36 to 9:39 to match the laptop time, and then reset the 7550 to check that the clocks still looked good. I chased some wasps out of the CR10X box and sealed the datalogger holes with duct putty. LI-7500 readings: CO2 393ppm H2O 530ppm T 19.2C P 101.8kPa SS 102 --> 102 after cleaning LI7700 readings: CH4 1.93ppm RSSI 43 --> 73 after cleaning We left at 10:50 PDT. |
1 photos found

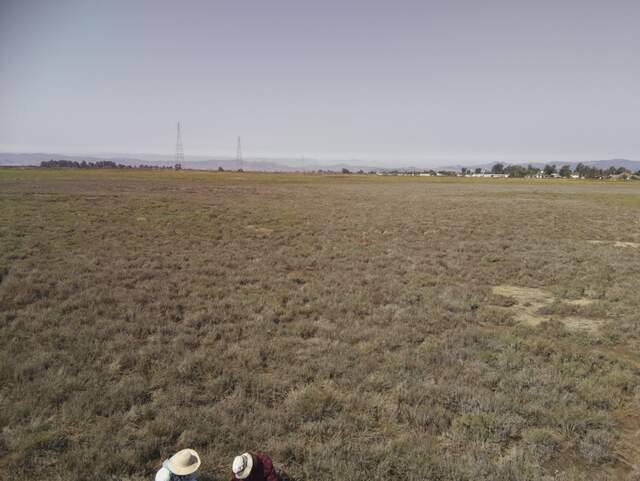
HS_picam_20210825_0945.jpg ( 2021-08-25 09:45:05 ) Full size: 1917x1440
Daphne and Joe on site
4 sets found
21 HS_met graphs found
4 HS_flux graphs found
1 HS_cam graphs found
Can't check HS_Processed
2 HS_Processed graphs found

