
Field Notes
<--2020-05-29 08:30:00 | 2020-06-16 10:35:00-->Other sites visited today: Sherman Barn | Sherman Wetland
Phenocam link: Searching...
Mayberry: 2020-06-02 10:00:00 (DOY 154)
Author: Daphne Szutu
Others: Christiana, Ariane
Summary: Regular data download/cleaning, water samples for Isabel, Ariane's water samples, added collar to FD chamber, no camera photos
| 2020-06-02 Mayberry Christiana (UCM visitor) and I arrived at 10:00 PDT. It was a hot, breezy day with some cirrus clouds. The goats have done a thorough job of cleaning up the weeds by the solar panels and our parking area. The wetland is about ½ green. The water level was 32 cm, lower than last time. Ariane collected water samples. Ariane- I arrived at 8:55 at Mayberry and started collecting water samples at the outlet and 0.9 footprint site. Then, I drove to the tower to get started with the wetland sites across the footprint. The goats have cleared the parking area and made an opening in the wetland that allowed me to get to the sampling sites without having to go around the channel edge. There were a few centimeters of standing water at the 0.5 footprint site but the other sites were dry. I took porewater samples at 10 and 30 cm depth at 0.5, 0.7 and 0.8 footprint sites. It is hard to get water below 10 cm at any of the sites due to the low hydraulic conductivity matrix in the clayey soil. At the sites where the peristaltic pump could not create enough hydraulic differential, I hooked up a syringe assembly and pulled out the plunger to create max vacuum. Holding the plunger out for 30 seconds allowed me to collect almost a full syringe. I brought a manual sipper to use at the sites where the sedpoints clogged. At these sites what works best is operating the manuel sipper as a lysimeter. I collected a couple more samples of surface water at the channels to the west and in front of the tower. Readings at the tower (Surface water): Conductivity: 4998 uS Salinity: 2.83 ppt pH: 8.47 Temp: 22.7 C Mean of porewaters at vegetated sites: Conductivity: 7924 uS Salinity: 4.74 ppt pH: 6.68 Temp: 20.8 C I downloaded met, FD, miniDOT, and USB GHG data. The camera was off and did not have any photos on it. It probably turned off during the power brown-outs during the last site visit while the fluorometer was plugged in. I cleaned the flux and rad sensors—there were spiderwebs all over the flux sensors and the sonic transducers. I collected water samples for Isabel at 9:30 PST. I changed the desiccant for the water level sensor and the miniDOT. The wash reservoir was mostly full; I topped it off. When we arrived, the FD chamber was above the water surface and there was a brown, leggy insect inside (picture below). I removed the chamber and added a PVC collar to the bottom. It didn’t quite fit, so I used a knife to shave off a little of the inside diameter from the collar to make it fit over the chamber lip. After I downloaded the FD data, I changed the FD time from 15:01 to 11:01 to match the laptop time. LI-7500 readings: CO2 420ppm H2O 680ppm T 27.5C P 101.2kPa SS 97--> 99 after cleaning LI7700 readings: CH4 1.99ppm RSSI 40-->78 after cleaning I left at 13:30. |
1 photos found
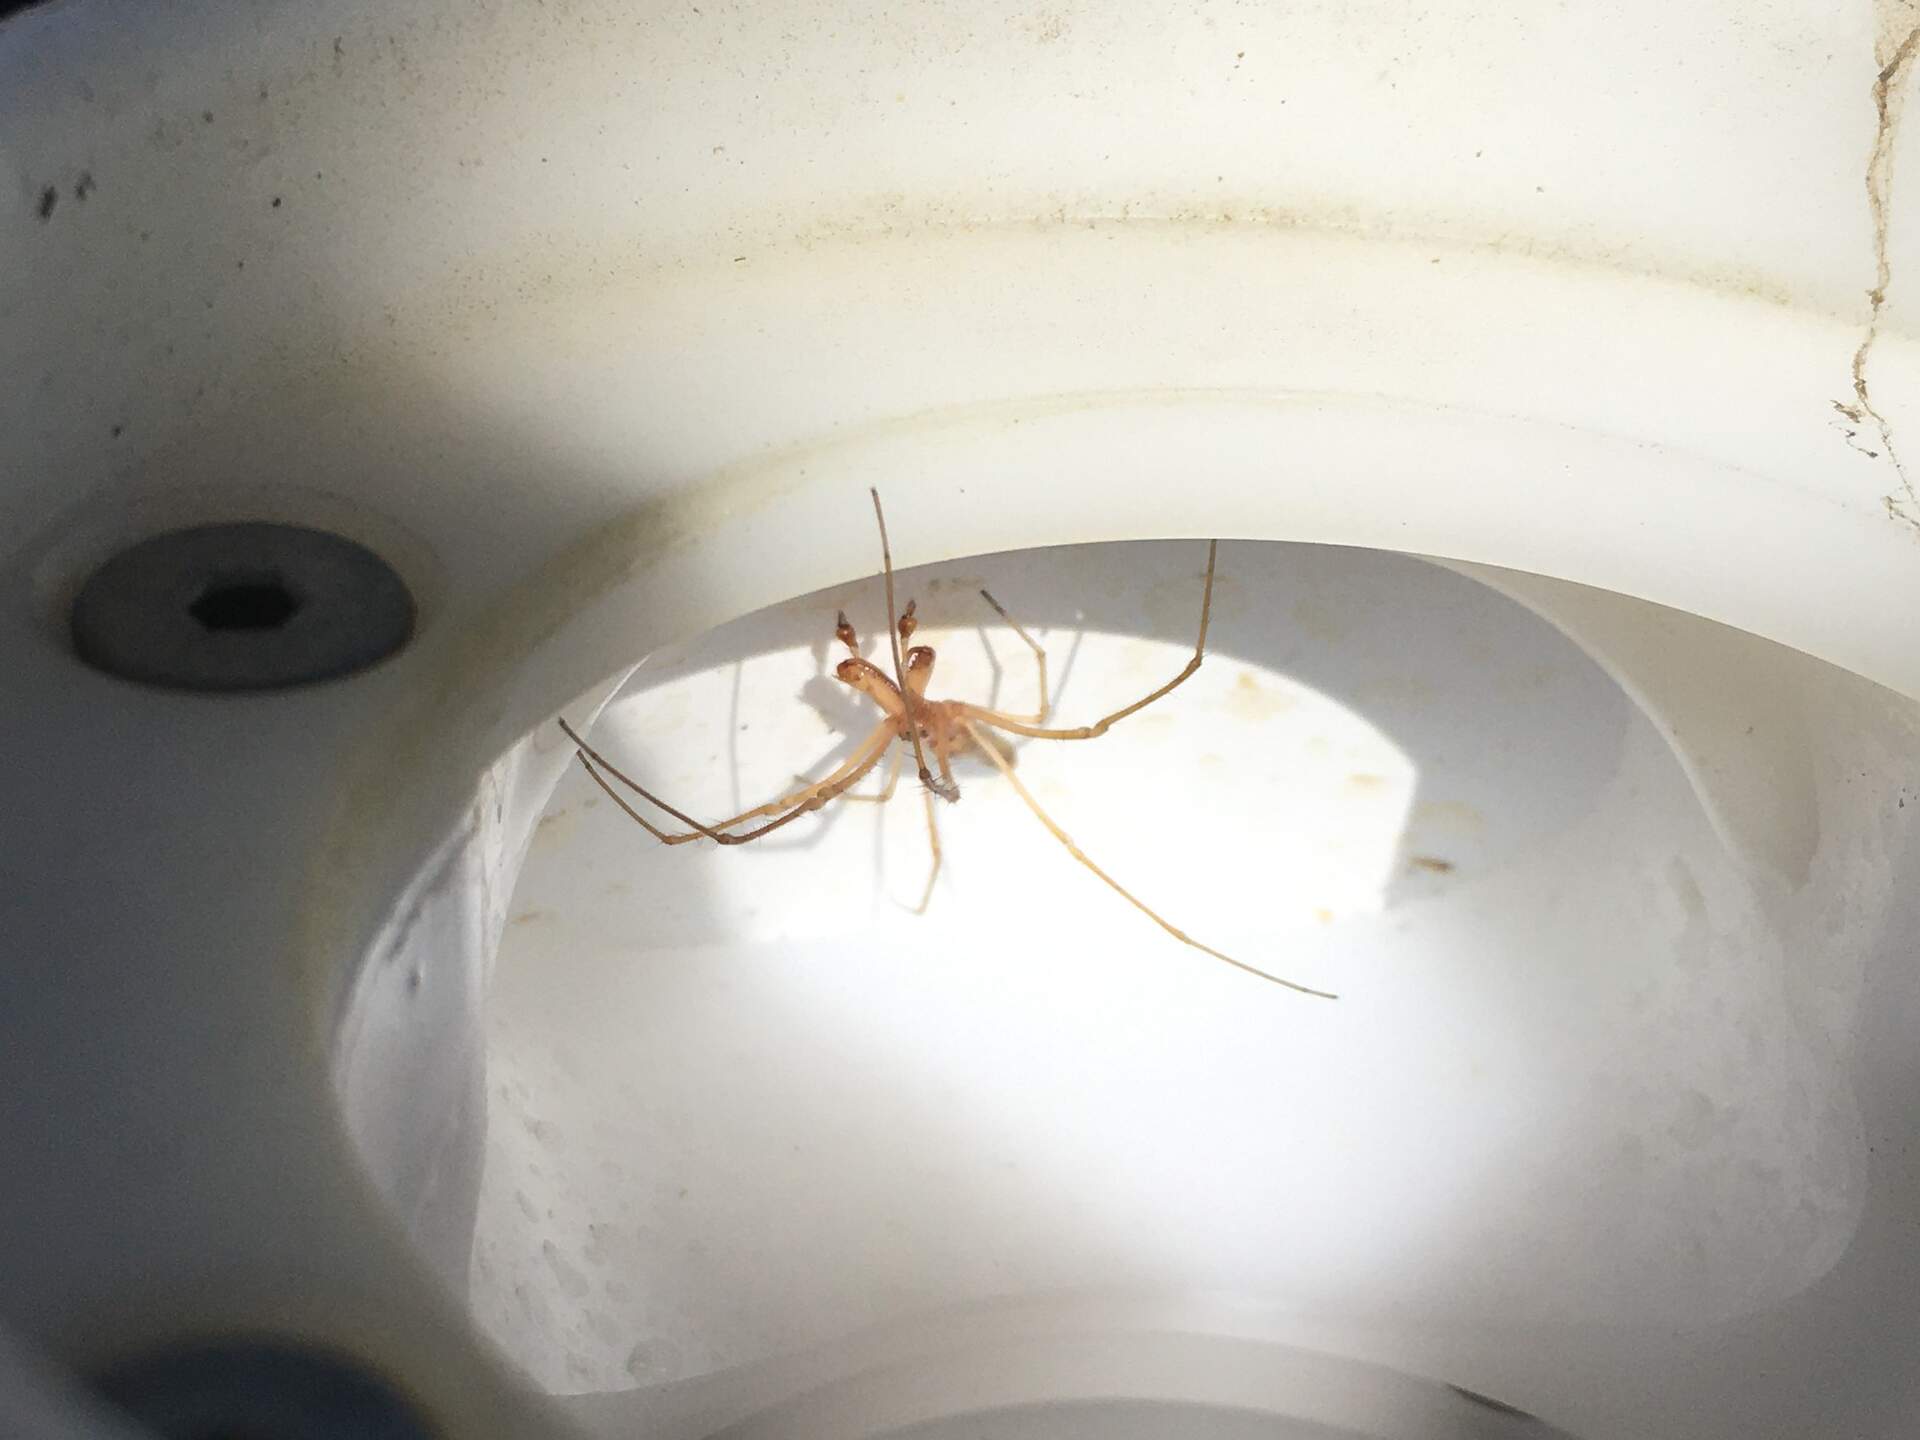
20200602MB_SpiderFd.jpg ( 2020-06-02 11:19:03 ) Full size: 1920x1440
Brown, leggy insect inside FD chamber (mounted on floating boom) that was currently above water.
11 sets found
7 MB_flux graphs found
No data found for MB_met.
28 MB_tule graphs found
Can't check MBWPEESWGT_mixed
1 MB_cam graphs found
Can't check MBEEWPSWEPGT_cam
Can't check SIMBTWEE_met
1 MB_minidot graphs found
Can't check MBSWEEWPBCBA
1 MB_processed graphs found
Can't check MB_fd
1 MB_fd graphs found