
Field Notes
<--2020-04-18 13:00:00 | 2020-05-23 10:30:00-->Other sites visited today: Tonzi | Tonzi
Phenocam link: Searching...
Vaira: 2020-05-05 10:15:00 (DOY 126)
Author: Daphne Szutu
Others: Siyan
Summary: Regular data collection/cleaning, grass about 1/4 brown, walked to pond, cleaned camera window
| 2020-05-05 Vaira Siyan and I arrived around 10:15 PDT in our separate cars. This is our 8th week of sheltering in place, with at least 3 more weeks to go. It was a warm and sunny day with blue skies, a little breeze, and a clear view of the Sierras. The grass is starting to turn brown already. It’s been a drier winter, and there hasn’t been rain since the first weekend in April. The watering hole looked mostly full, though. Siyan parked by the tower and walked to the pond to download data. I cleaned the radiometers and the camera window, where there were some black spots on the outside of the window. I shook some debris out of the precip bucket. I downloaded met, GHG, soil CO2, phenocam, and FD data. I did not clear the FD chambers. Siyan took well level and soil moisture measurements. I took jaz spectral measurements and took clip plot samples. We measured veg height. I pulled some of the more egregious weeds in our enclosure. We left around 12:00 PDT. |
Field Data
No tank data
Well Depth
| Date | Location | Depth (feet) |
|---|---|---|
| 2020-05-05 | VR_well | 54.4 |
| 2020-05-05 | TZ_floor | 27.4 |
| 2020-05-05 | TZ_tower | 31.2 |
| 2020-05-05 | TZ_road | 35.9 |
mode = both
Moisture Point Probes TZ
Array
(
[0] => Tower_1
[1] => Floor_South_1
[2] => Floor_West_1
[3] => Soil_Transect_4_1
[4] => Soil_Transect_3_1
[5] => Soil_Transect_2_1
[6] => Soil_Transect_1_1
[7] => SoilCO2_West_A_1
[8] => SoilCO2_West_B_1
[9] => SoilCO2_West_C_1
[10] => Tower_2
[11] => Floor_South_2
[12] => Floor_West_2
[13] => Soil_Transect_4_2
[14] => Soil_Transect_3_2
[15] => Soil_Transect_2_2
[16] => Soil_Transect_1_2
[17] => SoilCO2_West_A_2
[18] => SoilCO2_West_B_2
[19] => SoilCO2_West_C_2
[20] => Tower_3
[21] => Floor_South_3
[22] => Floor_West_3
[23] => Soil_Transect_4_3
[24] => Soil_Transect_3_3
[25] => Soil_Transect_2_3
[26] => Soil_Transect_1_3
[27] => SoilCO2_West_A_3
[28] => SoilCO2_West_B_3
[29] => SoilCO2_West_C_3
[30] => Tower_4
[31] => Floor_South_4
[32] => Floor_West_4
[33] => Soil_Transect_4_4
[34] => Soil_Transect_3_4
[35] => Soil_Transect_2_4
[36] => Soil_Transect_1_4
[37] => SoilCO2_West_A_4
[38] => SoilCO2_West_B_4
[39] => SoilCO2_West_C_4
)
| Date | DOY | Rep | Depth | Tower_1 |
Floor_South_1 |
Floor_West_1 |
Soil_Transect_4_1 |
Soil_Transect_3_1 |
Soil_Transect_2_1 |
Soil_Transect_1_1 |
SoilCO2_West_A_1 |
SoilCO2_West_B_1 |
SoilCO2_West_C_1 |
Tower_2 |
Floor_South_2 |
Floor_West_2 |
Soil_Transect_4_2 |
Soil_Transect_3_2 |
Soil_Transect_2_2 |
Soil_Transect_1_2 |
SoilCO2_West_A_2 |
SoilCO2_West_B_2 |
SoilCO2_West_C_2 |
Tower_3 |
Floor_South_3 |
Floor_West_3 |
Soil_Transect_4_3 |
Soil_Transect_3_3 |
Soil_Transect_2_3 |
Soil_Transect_1_3 |
SoilCO2_West_A_3 |
SoilCO2_West_B_3 |
SoilCO2_West_C_3 |
Tower_4 |
Floor_South_4 |
Floor_West_4 |
Soil_Transect_4_4 |
Soil_Transect_3_4 |
Soil_Transect_2_4 |
Soil_Transect_1_4 |
SoilCO2_West_A_4 |
SoilCO2_West_B_4 |
SoilCO2_West_C_4 |
Avg | Spacial Count |
Measurement Count |
|---|---|---|---|---|---|---|---|---|---|---|---|---|---|---|---|---|---|---|---|---|---|---|---|---|---|---|---|---|---|---|---|---|---|---|---|---|---|---|---|---|---|---|---|---|---|---|
| 2020-05-05 | 126 | 0 | nan | 8.8 | 5.6 | 10.3 | 0.3 | 1.6 | 10 | 5.3 | 16.2 | 10 | 8.8 | 15.8 | 13.1 | 17 | 13.1 | 19.1 | 21 | 7.8 | 14.8 | 6.9 | 18.8 | 21.8 | 24.3 | 21.8 | 16.9 | 21.5 | 25.1 | 22.59 | 24.8 | 23.5 | 25.7 | 33.1 | 25.6 | 36.5 | 20.5 | 37.1 | 41.4 | 21.3 | 39.1 | 39.1 | 41.7 | |||
| 2020-05-05 | 126 | 1 | nan | 9.7 | 5.9 | 10.3 | 2.7 | 1.1 | 11.1 | 5.9 | 16.8 | 10.3 | 9.4 | 15.8 | 12.1 | 16.7 | 11.8 | 18.8 | 20.6 | 7.8 | 13.3 | 6.6 | 19.4 | 21.8 | 24 | 21.8 | 16.8 | 21.8 | 25.1 | 23.2 | 23.7 | 22.9 | 25.7 | 34 | 35.4 | 34.8 | 21.1 | 36.5 | 41.4 | 21.9 | 39.4 | 41.1 | 42.5 | |||
| 2020-05-05 | 126 | Avg | 0-15cm | 0 | 0 | |||||||||||||||||||||||||||||||||||||||||
| 2020-05-05 | 126 | Avg | 15-30cm | 0 | 0 | |||||||||||||||||||||||||||||||||||||||||
| 2020-05-05 | 126 | Avg | 30-45cm | 0 | 0 | |||||||||||||||||||||||||||||||||||||||||
| 2020-05-05 | 126 | Avg | 45-60cm | 0 | 0 |
mode = both
Moisture Point Probes VR
Array
(
[0] => Flux_Tower_1
[1] => Biomass_Cage_1
[2] => Flux_Tower_2
[3] => Biomass_Cage_2
[4] => Flux_Tower_3
[5] => Biomass_Cage_3
[6] => Flux_Tower_4
[7] => Biomass_Cage_4
)
| Date | DOY | Rep | Depth | Flux_Tower_1 |
Biomass_Cage_1 |
Flux_Tower_2 |
Biomass_Cage_2 |
Flux_Tower_3 |
Biomass_Cage_3 |
Flux_Tower_4 |
Biomass_Cage_4 |
Avg | Spacial Count |
Measurement Count |
|---|---|---|---|---|---|---|---|---|---|---|---|---|---|---|
| 2020-05-05 | 126 | 0 | nan | 3.6 | 2.4 | 13.6 | 8.1 | 7 | 7.3 | 18.5 | 18.8 | |||
| 2020-05-05 | 126 | 1 | nan | 3 | 4.3 | 13.9 | 7.8 | 7.3 | 18.2 | 17.9 | 19.9 | |||
| 2020-05-05 | 126 | Avg | 0-15cm | 0 | 0 | |||||||||
| 2020-05-05 | 126 | Avg | 15-30cm | 0 | 0 | |||||||||
| 2020-05-05 | 126 | Avg | 30-45cm | 0 | 0 | |||||||||
| 2020-05-05 | 126 | Avg | 45-60cm | 0 | 0 |
Grass Height TZ 15
| Date | Height reps (cm) | Location | Average | Samp | STDEV | ||||||||||||||
|---|---|---|---|---|---|---|---|---|---|---|---|---|---|---|---|---|---|---|---|
| 2020-05-05 | 14 | 13 | 11 | 7 | 21 | 12 | 24 | 11 | 16 | 11 | 23 | 17 | 10 | 17 | 13 | GH_ALL | 14.67 | 15 | 4.78 |
Grass Height VR 15
| Date | Height reps (cm) | Location | Average | Samp | STDEV | ||||||||||||||
|---|---|---|---|---|---|---|---|---|---|---|---|---|---|---|---|---|---|---|---|
| 2020-05-05 | 40 | 15 | 32 | 40 | 21 | 26 | 22 | 21 | 8 | 16 | 36 | 18 | 36 | 30 | 34 | GH_ALL | 26.33 | 15 | 9.6 |
No VR Tree DBH found
No water potential data found
No VR Grass Biomass data found
No VR OakLeaves Biomass data found
No VR PineNeedles Biomass data found
1 photos found
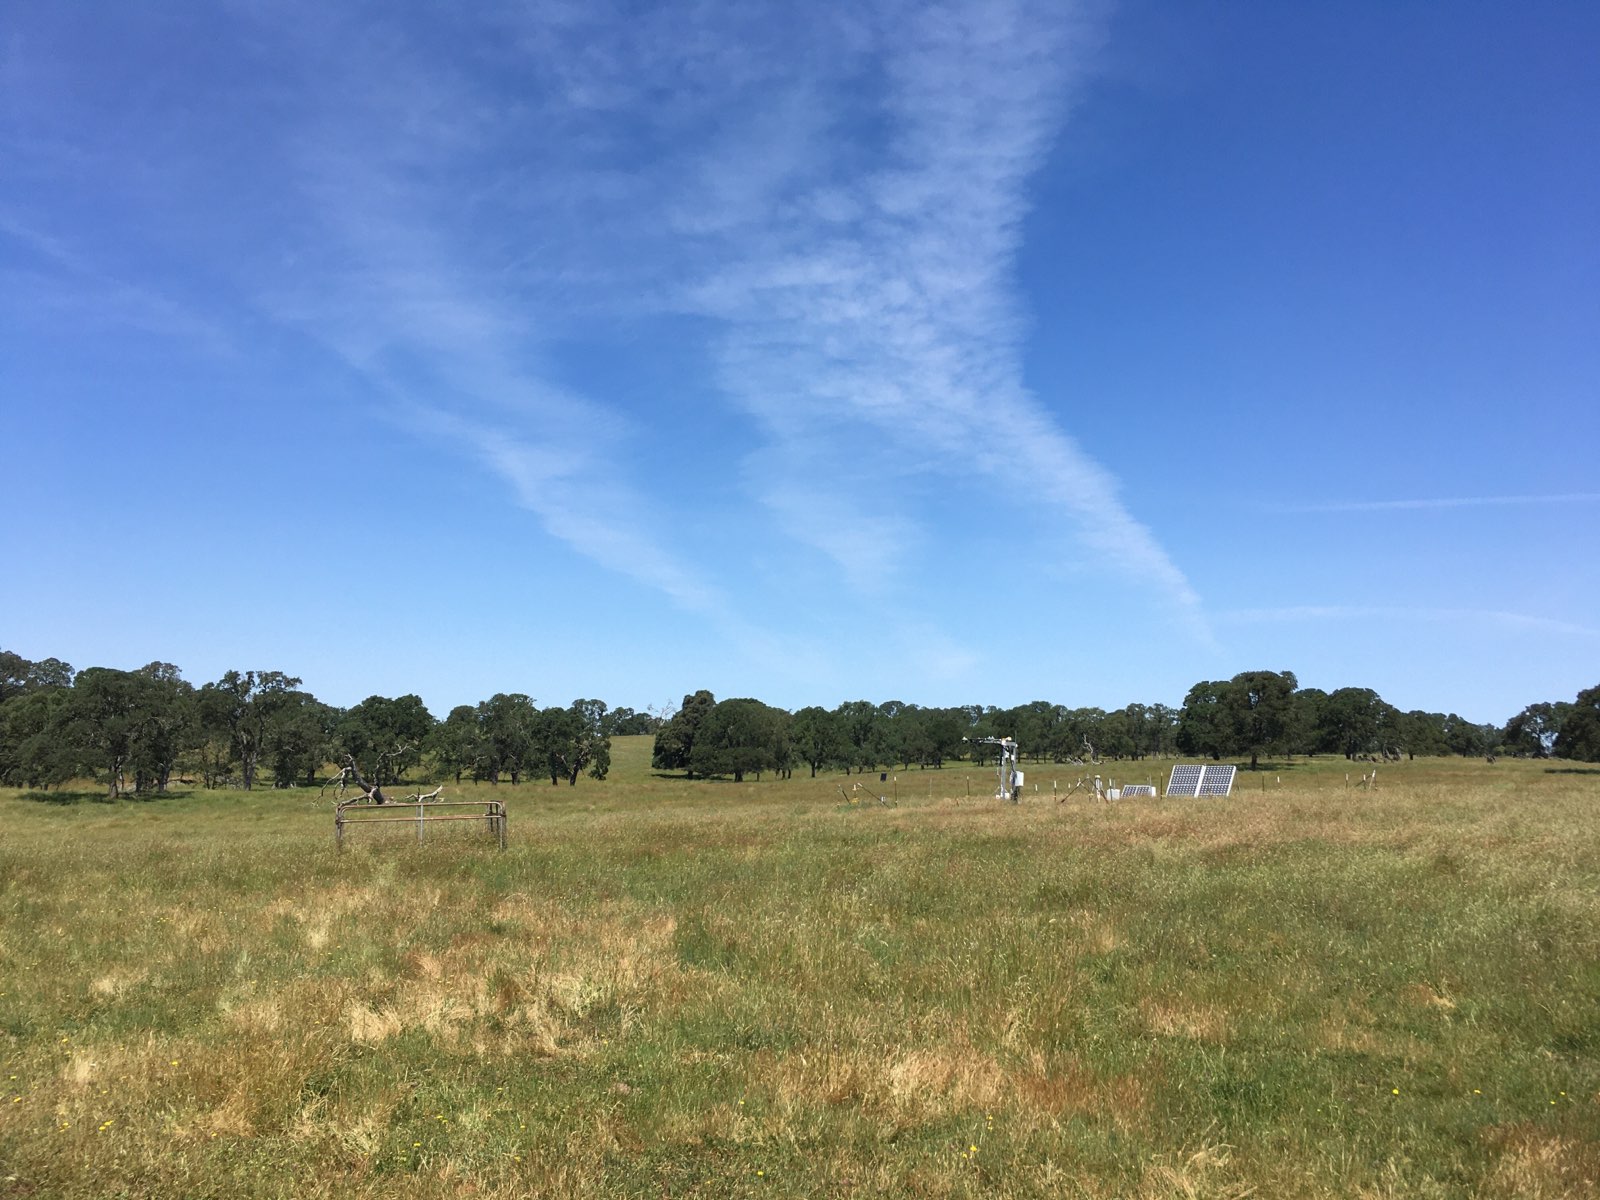
20200505VR_SenescingGrass.jpg ( 2020-05-05 00:00:00 ) Full size: 1600x1200
Senescing grass
9 sets found
16 VR_met graphs found
2 VR_flux graphs found
6 VR_soilco2 graphs found
2 VR_pond graphs found
Can't check TZVR_mixed
3 VR_fd graphs found
No data found for VR_processed.
4 VR_arable graphs found
No data found for VR_soilvue.