Field Notes
<--2019-09-09 11:00:00 | 2019-10-09 10:30:00-->Other sites visited today: Tonzi | Tonzi
Phenocam link: Searching...
Vaira: 2019-09-25 10:00:00 (DOY 268)
Author: Joe Verfaillie
Others: Siyan
Summary: Recent rain, grass under trees, went to the pond, cows around
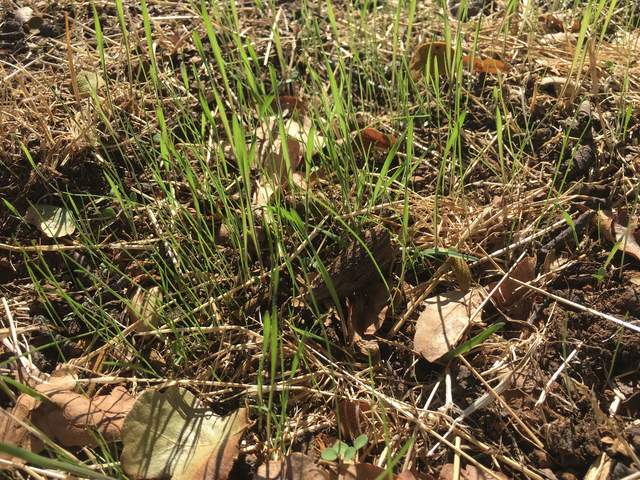
| Vaira 2019-09-25 Siyan and I arrived at 10:00. It was clear sunny and hot. There was some rain Monday and Wednesday of last week. Usually the first rains leave muddy streaks on the instruments and solar panels but I didn’t notice that. And there was grass coming up in under many of the trees and along the banks of the stream from the pond. So maybe it rained pretty hard – hard enough to wash the sensors clean. I collected the data. The CO2 was reading pretty high but the 7500 seemed clean. The 7500 read: 418.7ppm CO2, 648.5mmol/m3 H2O, 30.6C, 98.9kPa, 95.2SS The radiation sensors were clean. Siyan did soil moisture, clip plots and the well reading. We went to the pond. The pond level was 14.48ft. Cows had been walking along the edge of the water and kicking the water pressure conduit. It still seemed intact and I piled some rocks around it to protect it. |
Field Data
No tank data
Well Depth
| Date | Location | Depth (feet) |
|---|---|---|
| 2019-09-25 | VR_well | 57.8 |
| 2019-09-25 | TZ_floor | 25.4 |
| 2019-09-25 | TZ_tower | 30.4 |
| 2019-09-25 | TZ_road | 34.9 |
mode = both
Moisture Point Probes TZ
Array
(
[0] => Tower_1
[1] => Floor_South_1
[2] => Floor_West_1
[3] => Soil_Transect_4_1
[4] => Soil_Transect_3_1
[5] => Soil_Transect_2_1
[6] => Soil_Transect_1_1
[7] => SoilCO2_West_B_1
[8] => SoilCO2_West_C_1
[9] => Tower_2
[10] => Floor_South_2
[11] => Floor_West_2
[12] => Soil_Transect_4_2
[13] => Soil_Transect_3_2
[14] => Soil_Transect_2_2
[15] => Soil_Transect_1_2
[16] => SoilCO2_West_A_2
[17] => SoilCO2_West_B_2
[18] => SoilCO2_West_C_2
[19] => Tower_3
[20] => Floor_South_3
[21] => Floor_West_3
[22] => Soil_Transect_4_3
[23] => Soil_Transect_3_3
[24] => Soil_Transect_2_3
[25] => Soil_Transect_1_3
[26] => SoilCO2_West_A_3
[27] => SoilCO2_West_B_3
[28] => SoilCO2_West_C_3
[29] => Tower_4
[30] => Floor_South_4
[31] => Soil_Transect_4_4
[32] => Soil_Transect_3_4
[33] => Soil_Transect_1_4
[34] => SoilCO2_West_A_4
[35] => SoilCO2_West_B_4
[36] => SoilCO2_West_C_4
[37] => Soil_Transect_2_4
)
| Date | DOY | Rep | Depth | Tower_1 |
Floor_South_1 |
Floor_West_1 |
Soil_Transect_4_1 |
Soil_Transect_3_1 |
Soil_Transect_2_1 |
Soil_Transect_1_1 |
SoilCO2_West_B_1 |
SoilCO2_West_C_1 |
Tower_2 |
Floor_South_2 |
Floor_West_2 |
Soil_Transect_4_2 |
Soil_Transect_3_2 |
Soil_Transect_2_2 |
Soil_Transect_1_2 |
SoilCO2_West_A_2 |
SoilCO2_West_B_2 |
SoilCO2_West_C_2 |
Tower_3 |
Floor_South_3 |
Floor_West_3 |
Soil_Transect_4_3 |
Soil_Transect_3_3 |
Soil_Transect_2_3 |
Soil_Transect_1_3 |
SoilCO2_West_A_3 |
SoilCO2_West_B_3 |
SoilCO2_West_C_3 |
Tower_4 |
Floor_South_4 |
Soil_Transect_4_4 |
Soil_Transect_3_4 |
Soil_Transect_1_4 |
SoilCO2_West_A_4 |
SoilCO2_West_B_4 |
SoilCO2_West_C_4 |
Soil_Transect_2_4 |
Avg | Spacial Count |
Measurement Count |
|---|---|---|---|---|---|---|---|---|---|---|---|---|---|---|---|---|---|---|---|---|---|---|---|---|---|---|---|---|---|---|---|---|---|---|---|---|---|---|---|---|---|---|---|---|
| 2019-09-25 | 268 | 0 | nan | 6.5 | 0.1 | 6.2 | 3.6 | 6.5 | 4.8 | 2.4 | 10 | 0.3 | 10.9 | 6.6 | 7.5 | 8.4 | 14.5 | 25.2 | 4.8 | 5.7 | 0.9 | 12.1 | 13.4 | 8.7 | 9.5 | 9.5 | 12.3 | 24.3 | 13.4 | 15.9 | 14.3 | 13.7 | 17.6 | 9.3 | 10.5 | 20.2 | 11.3 | 15.9 | 18.2 | 23.8 | ||||
| 2019-09-25 | 268 | 1 | nan | 6.2 | 7.1 | 5 | 4.7 | 6.5 | 5.4 | 2.4 | 9.7 | 0.1 | 10.2 | 6.6 | 6.9 | 8.1 | 14.5 | 28 | 4.8 | 6.3 | 1.5 | 12.7 | 14 | 9 | 9.5 | 12.6 | 3.7 | 13.9 | 15.4 | 15.1 | 13.4 | 18.2 | 8.5 | 11 | 20.5 | 11.6 | 15.3 | 17.6 | 23.9 | 26 | ||||
| 2019-09-25 | 268 | Avg | 0-15cm | 0 | 0 | |||||||||||||||||||||||||||||||||||||||
| 2019-09-25 | 268 | Avg | 15-30cm | 0 | 0 | |||||||||||||||||||||||||||||||||||||||
| 2019-09-25 | 268 | Avg | 30-45cm | 0 | 0 | |||||||||||||||||||||||||||||||||||||||
| 2019-09-25 | 268 | Avg | 45-60cm | 0 | 0 |
mode = both
Moisture Point Probes VR
Array
(
[0] => Solar_Panels_1
[1] => Flux_Tower_1
[2] => Biomass_Cage_1
[3] => Solar_Panels_2
[4] => Flux_Tower_2
[5] => Biomass_Cage_2
[6] => Solar_Panels_3
[7] => Flux_Tower_3
[8] => Biomass_Cage_3
[9] => Solar_Panels_4
[10] => Flux_Tower_4
[11] => Biomass_Cage_4
)
| Date | DOY | Rep | Depth | Solar_Panels_1 |
Flux_Tower_1 |
Biomass_Cage_1 |
Solar_Panels_2 |
Flux_Tower_2 |
Biomass_Cage_2 |
Solar_Panels_3 |
Flux_Tower_3 |
Biomass_Cage_3 |
Solar_Panels_4 |
Flux_Tower_4 |
Biomass_Cage_4 |
Avg | Spacial Count |
Measurement Count |
|---|---|---|---|---|---|---|---|---|---|---|---|---|---|---|---|---|---|---|
| 2019-09-25 | 268 | 0 | nan | 6.2 | 5.9 | 4.2 | 12.4 | 13.6 | 7.2 | 15.9 | 6.4 | 17.6 | 28.8 | 17.3 | 20.5 | |||
| 2019-09-25 | 268 | 1 | nan | 6.2 | 6.2 | 4.7 | 12.4 | 12.4 | 7.5 | 16.5 | 7.3 | 17 | 29.7 | 17.3 | 21.1 | |||
| 2019-09-25 | 268 | Avg | 0-15cm | 0 | 0 | |||||||||||||
| 2019-09-25 | 268 | Avg | 15-30cm | 0 | 0 | |||||||||||||
| 2019-09-25 | 268 | Avg | 30-45cm | 0 | 0 | |||||||||||||
| 2019-09-25 | 268 | Avg | 45-60cm | 0 | 0 |
No TZ grass heigth found
No VR grass heigth found
No VR Tree DBH found
No water potential data found
No VR Grass Biomass data found
No VR OakLeaves Biomass data found
No VR PineNeedles Biomass data found
1 photos found

20190925VR_GrassSprouts.jpg ( 2019-09-25 00:00:00 ) Full size: 1920x1440
After rain last week, grass has sprouted under the trees
9 sets found
16 VR_met graphs found
2 VR_flux graphs found
6 VR_soilco2 graphs found
2 VR_pond graphs found
Can't check TZVR_mixed
No data found for VR_fd.
No data found for VR_processed.
4 VR_arable graphs found
No data found for VR_soilvue.

