
Field Notes
<--2019-09-11 08:15:00 | 2019-10-02 09:40:00-->Other sites visited today: Bouldin Alfalfa
Phenocam link: Searching...
Bouldin Corn: 2019-09-17 14:20:00 (DOY 260)
Author: Daphne Szutu
Others: Camilo
Summary: Removed zcams and moved soil sensors out of field, our field mostly harvested except for patch in front of tower
| 2019-09-17 Bouldin Corn Camilo and I arrived at 14:20. It was a sunny, warm, breezy, and mostly clear day one puffy cloud over Mt. Diablo. We had the first rains of the season yesterday. Our corn field has been mostly harvested, except for one patch in front of our tower where Tyler’s chambers are. There was lots of harvest traffic on the dirt roads, and most of the fields south of us had been or were currently being harvested. I removed the zcams and brought them back to the lab, although I forgot to power them down nicely through the web browser. I downloaded the phenocam data and swapped the water-level sensor desiccant. Camilo removed the 3 sets of soil sensors and the Theta soil moisture probe and put them under the tower (we did not install them in the weeds). Eventually we want to move our tower back so that the farm workers can disk the weeds and plant right up to the edge of the field. We left at 14:50. |
1 photos found
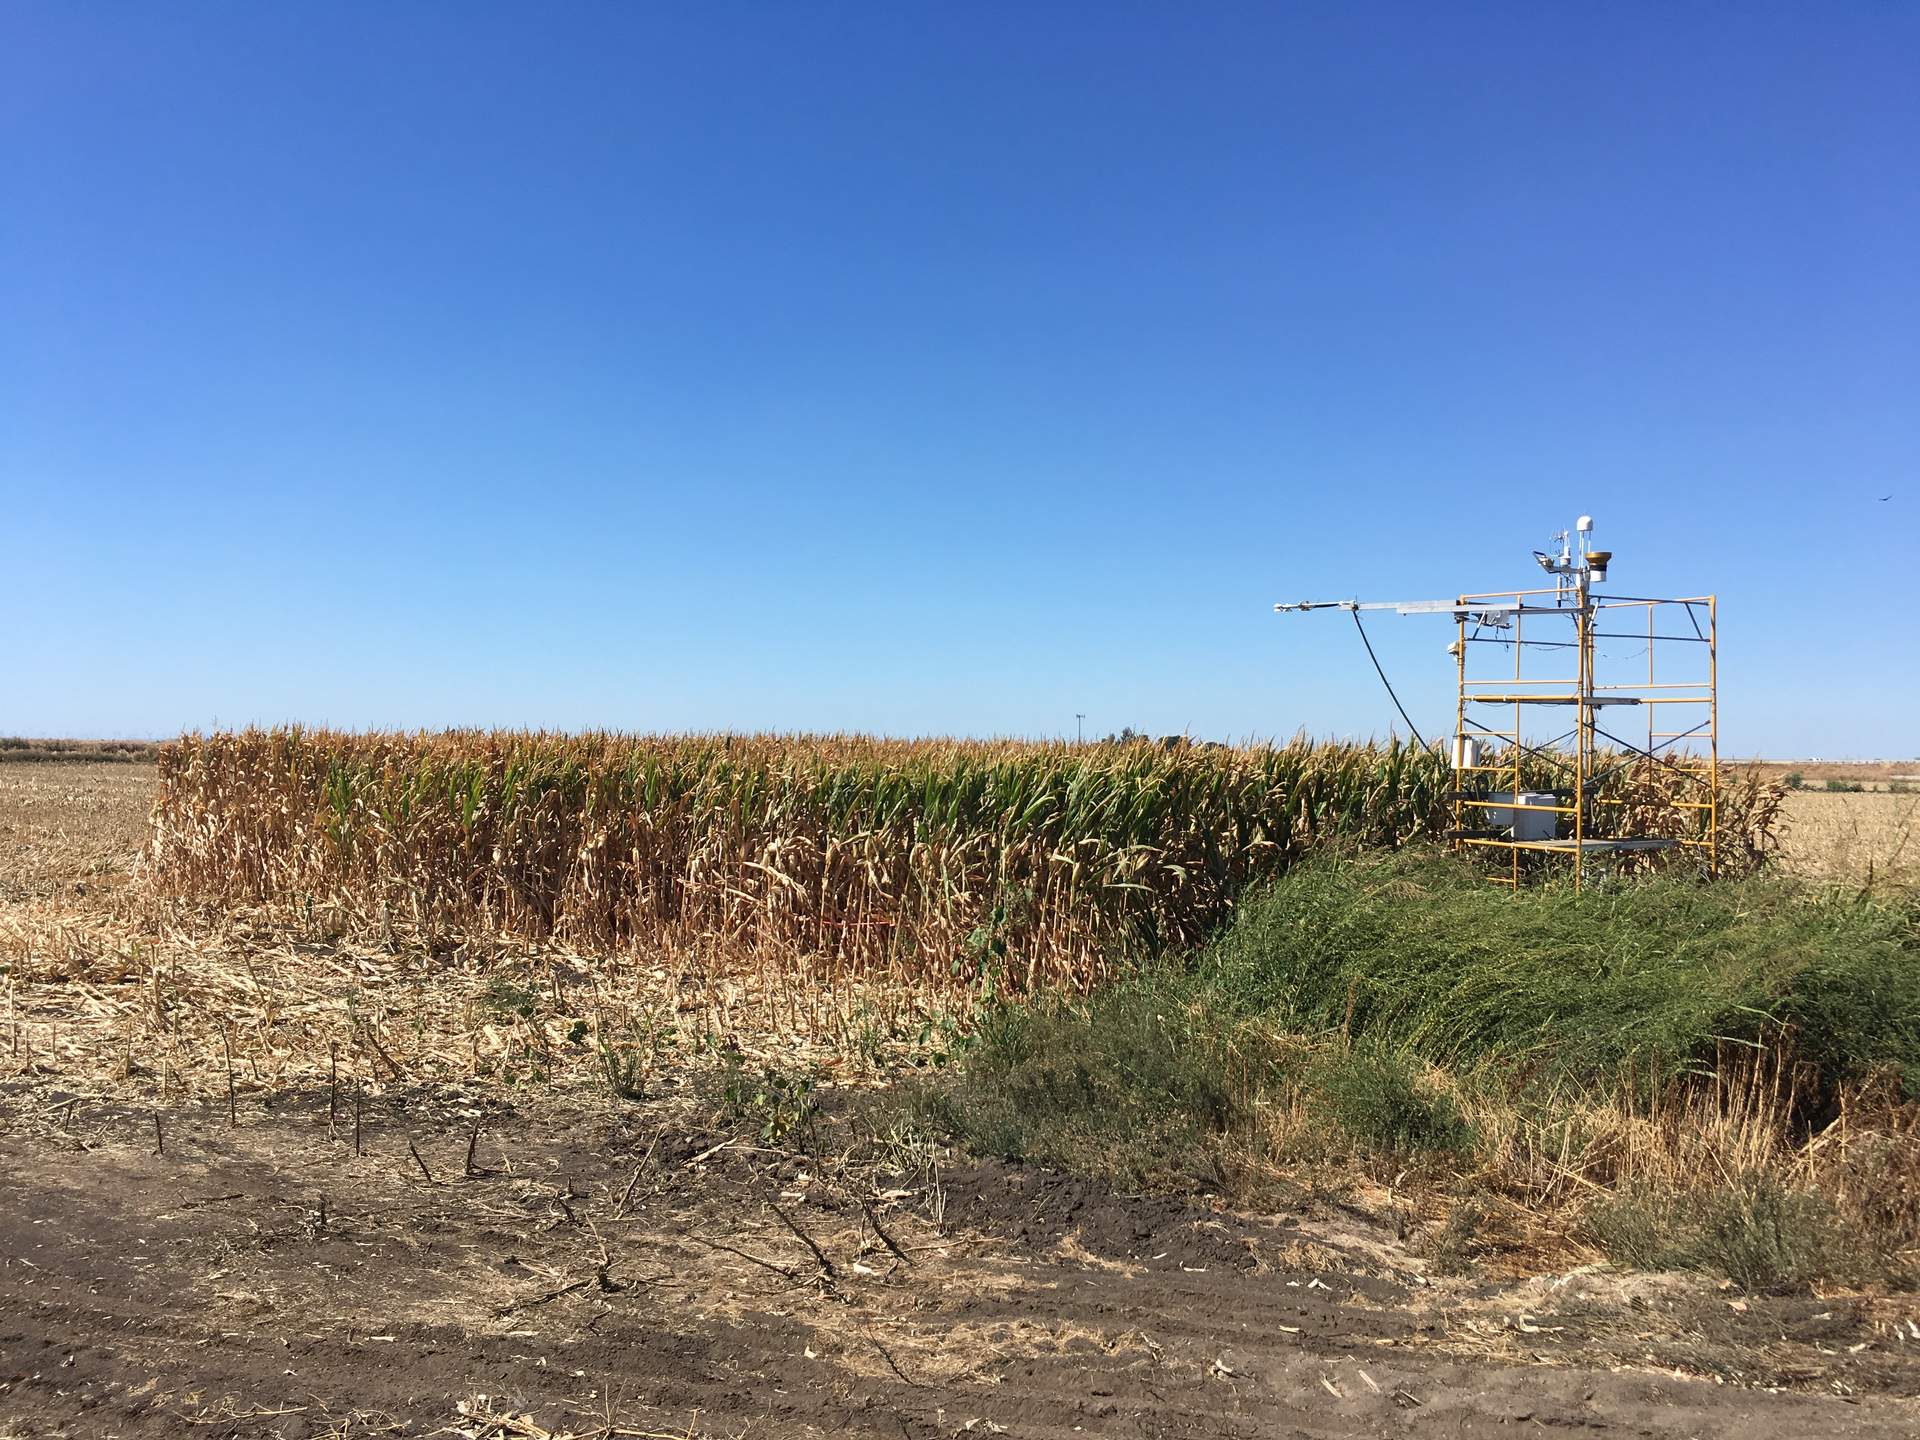
20190917BC_PersonalCornPatch.JPG ( 2019-09-17 14:20:15 ) Full size: 1920x1440
Our field was mostly harvested, except for a small patch in front of our tower where Tyler's chambers are located.
6 sets found
17 BC_met graphs found
5 BC_flux graphs found
Can't check TATWBABCSB_cam
Can't check MBSWEEWPBCBA
2 BC_pa graphs found
1 BC_arable graphs found