Field Notes
<--2019-09-11 13:30:00 | 2019-10-02 10:25:00-->Other sites visited today: Bouldin Corn
Phenocam link: Searching...
Bouldin Alfalfa: 2019-09-17 08:15:00 (DOY 260)
Author: Daphne Szutu
Others: Camilo
Summary: Regular data collection/cleaning, 6400 measurements, biomass samples, veg height, spectral, LAI, upper HMP RH issues--maybe fixed
| 2019-09-17 Bouldin Alfalfa Camilo and I arrived at 8:15. It was a sunny and mostly clear day with some cirrus clouds on the eastern horizon. We had the first rains of the season yesterday. It was cool and breezy when we arrived, but warmed up to muggy conditions. The alfalfa is tall and flowering. There were many yellow butterflies around, and as the day warmed up, wasps. Camilo took ACi and light-response curves on alfalfa. Camilo: I sampled 5 leaves. Each leaf had an A-Ci curve done and immediately after a light response curve. The light for the A-Ci curve was kept at 1500 umol m-2 s-1, and the CO2 for the LRC was kept at 400 umol m-2 s-1. It was not too hot so the temperature control did not need to be activated. We finished by 1:50 PM. I downloaded met, cam, USB GHG, and FD data. I cleaned the flux, rad, and Arable sensors/solar panels and removed the Arable bird spikes. The wash reservoir was mostly full; I topped it off. I took 5 clip plot samples, and spectral, veg height, and 2-wand LAI measurements. I took LAI samples with my back to the sun (~NW direction). RH2 from the upper HMP (sn G4540023) has been frequently maxing out since we installed it last month, especially in the early morning hours. I tried wiring it directly to the mux, but the issue was still there. I took the sensor down and unscrewed the cap; the Teflon filter was a bit wrinkly, and I think it was touching the sensor. I smoothed out the filter and put it back on the sensor, which seemed to fix the issue. I re-installed the sensor at the same height, but we should double-check the height before we take it down. I trimmed the alfalfa around the solar panels and under the tower, since I think they will be mowing next week (Tyler’s field was already mowed). I also left some mothballs in the met box. LI-7500 readings: CO2 461ppm H2O 713ppm T 16.9C P 101.7kPa SS 101--> 101 after cleaning LI7700 readings: CH4 2.2ppm RSSI 47-->76 after cleaning We left at 14:05 and took the back roads to the corn field. |
Next Mowing: 2019-09-21
Veg Height (cm): Tape measure from ground to top of plant - Measured by DS
80, 70, 77, 70, 67, 73, 77, 77, 67, 60, 61, 60, avg = 69.9, stdev = 7.1
3 photos found

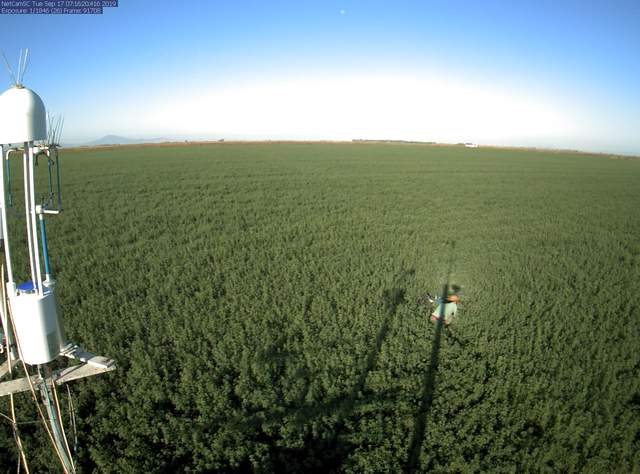
bouldinalfalfa_2019_09_17_071614.jpg ( 2019-09-17 07:25:30 ) Full size: 1296x960
Daphne working on leaf level measurements

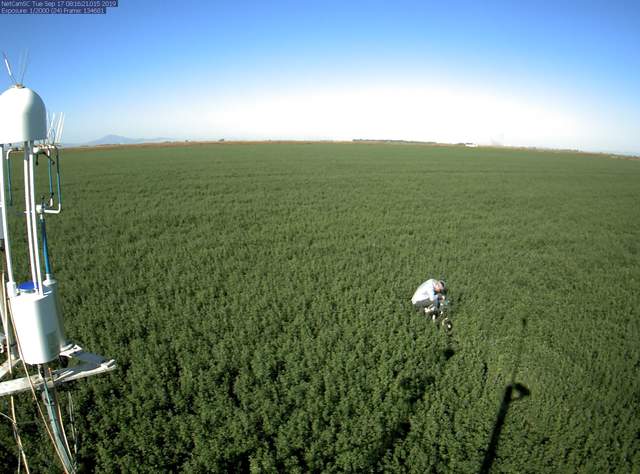
bouldinalfalfa_2019_09_17_081615.jpg ( 2019-09-17 08:25:34 ) Full size: 1296x960
Camilo working on leaf level measurements

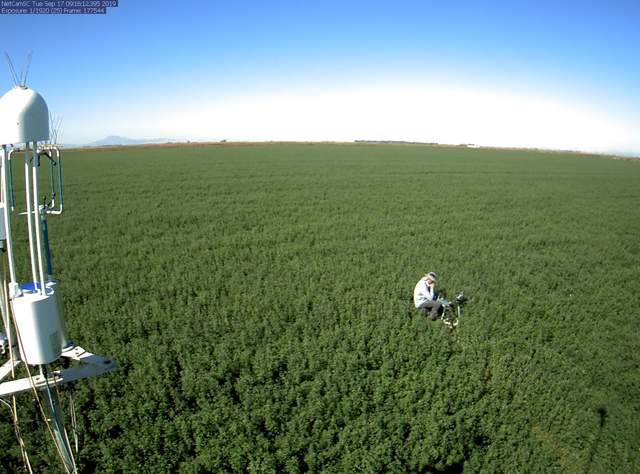
bouldinalfalfa_2019_09_17_091610.jpg ( 2019-09-17 09:25:26 ) Full size: 1296x960
Camilo working on leaf level measurements
7 sets found
5 BA_flux graphs found
21 BA_met graphs found
6 BA_arable graphs found
Can't check TATWBABCSB_cam
Can't check MBSWEEWPBCBA
2 BA_processed graphs found
No data found for BA_adex.

