
Field Notes
<--2009-11-06 11:00:00 | 2009-12-01 09:30:00-->Other sites visited today: Sherman Island
Phenocam link: Searching...
Twitchell Rice: 2009-11-19 10:30:00 (DOY 323)
Author: Joe Verfaillie
Others: Cove
Summary: Setup generator, Fields beginning to flood, LGR analyzer very cold when starting, Reset laptop password.
| Twitchell
11/19/2009 Arrived about 10:30am with Cove to setup the generator. Clear, cool, very light wind from the southwest. Late in the day very light wind from the north. Fields are beginning to flood. North part of our field is wet but the water has not percolated to the south end yet. Immediately next to our tower is still dry, but there is some water visible further out and slightly to the north. When we arrived the Campbell enclosure on the tower was wide open and there was evidence or rain from Tuesday on the equipment, but everything appeared to be in working order. The laptop seems to be off, with lid closed. Because of this no web cam photos were collected. Generator was set up along the road to the north of the tower. The power strip could not support the scroll pump so we had to run with the smaller diaphragm pump. When the LGR analyzer started up it was very cold (~4C). The water channel did not read initially and the other channels read high. Readings seem to begin to settle into more reasonable values as the analyzer warmed up. Adjusted bypass valve to bring pressure into good range. Returned about 2pm. LGR stats: 13:13, 1.930ppm, 6835.94ppm, 393.55ppm, 18.81C, 141.58Torr, 17.493usec, 10Hz I reset the laptop password to “pippo” and setup daily MD9 renaming of the CR1000 and CR23X files. I copied all data and images from the laptop and swapped cards on the CR1000. Separation between our tower and Franks tower at their original locations on the berm was 12.2 meters. |
7 photos found
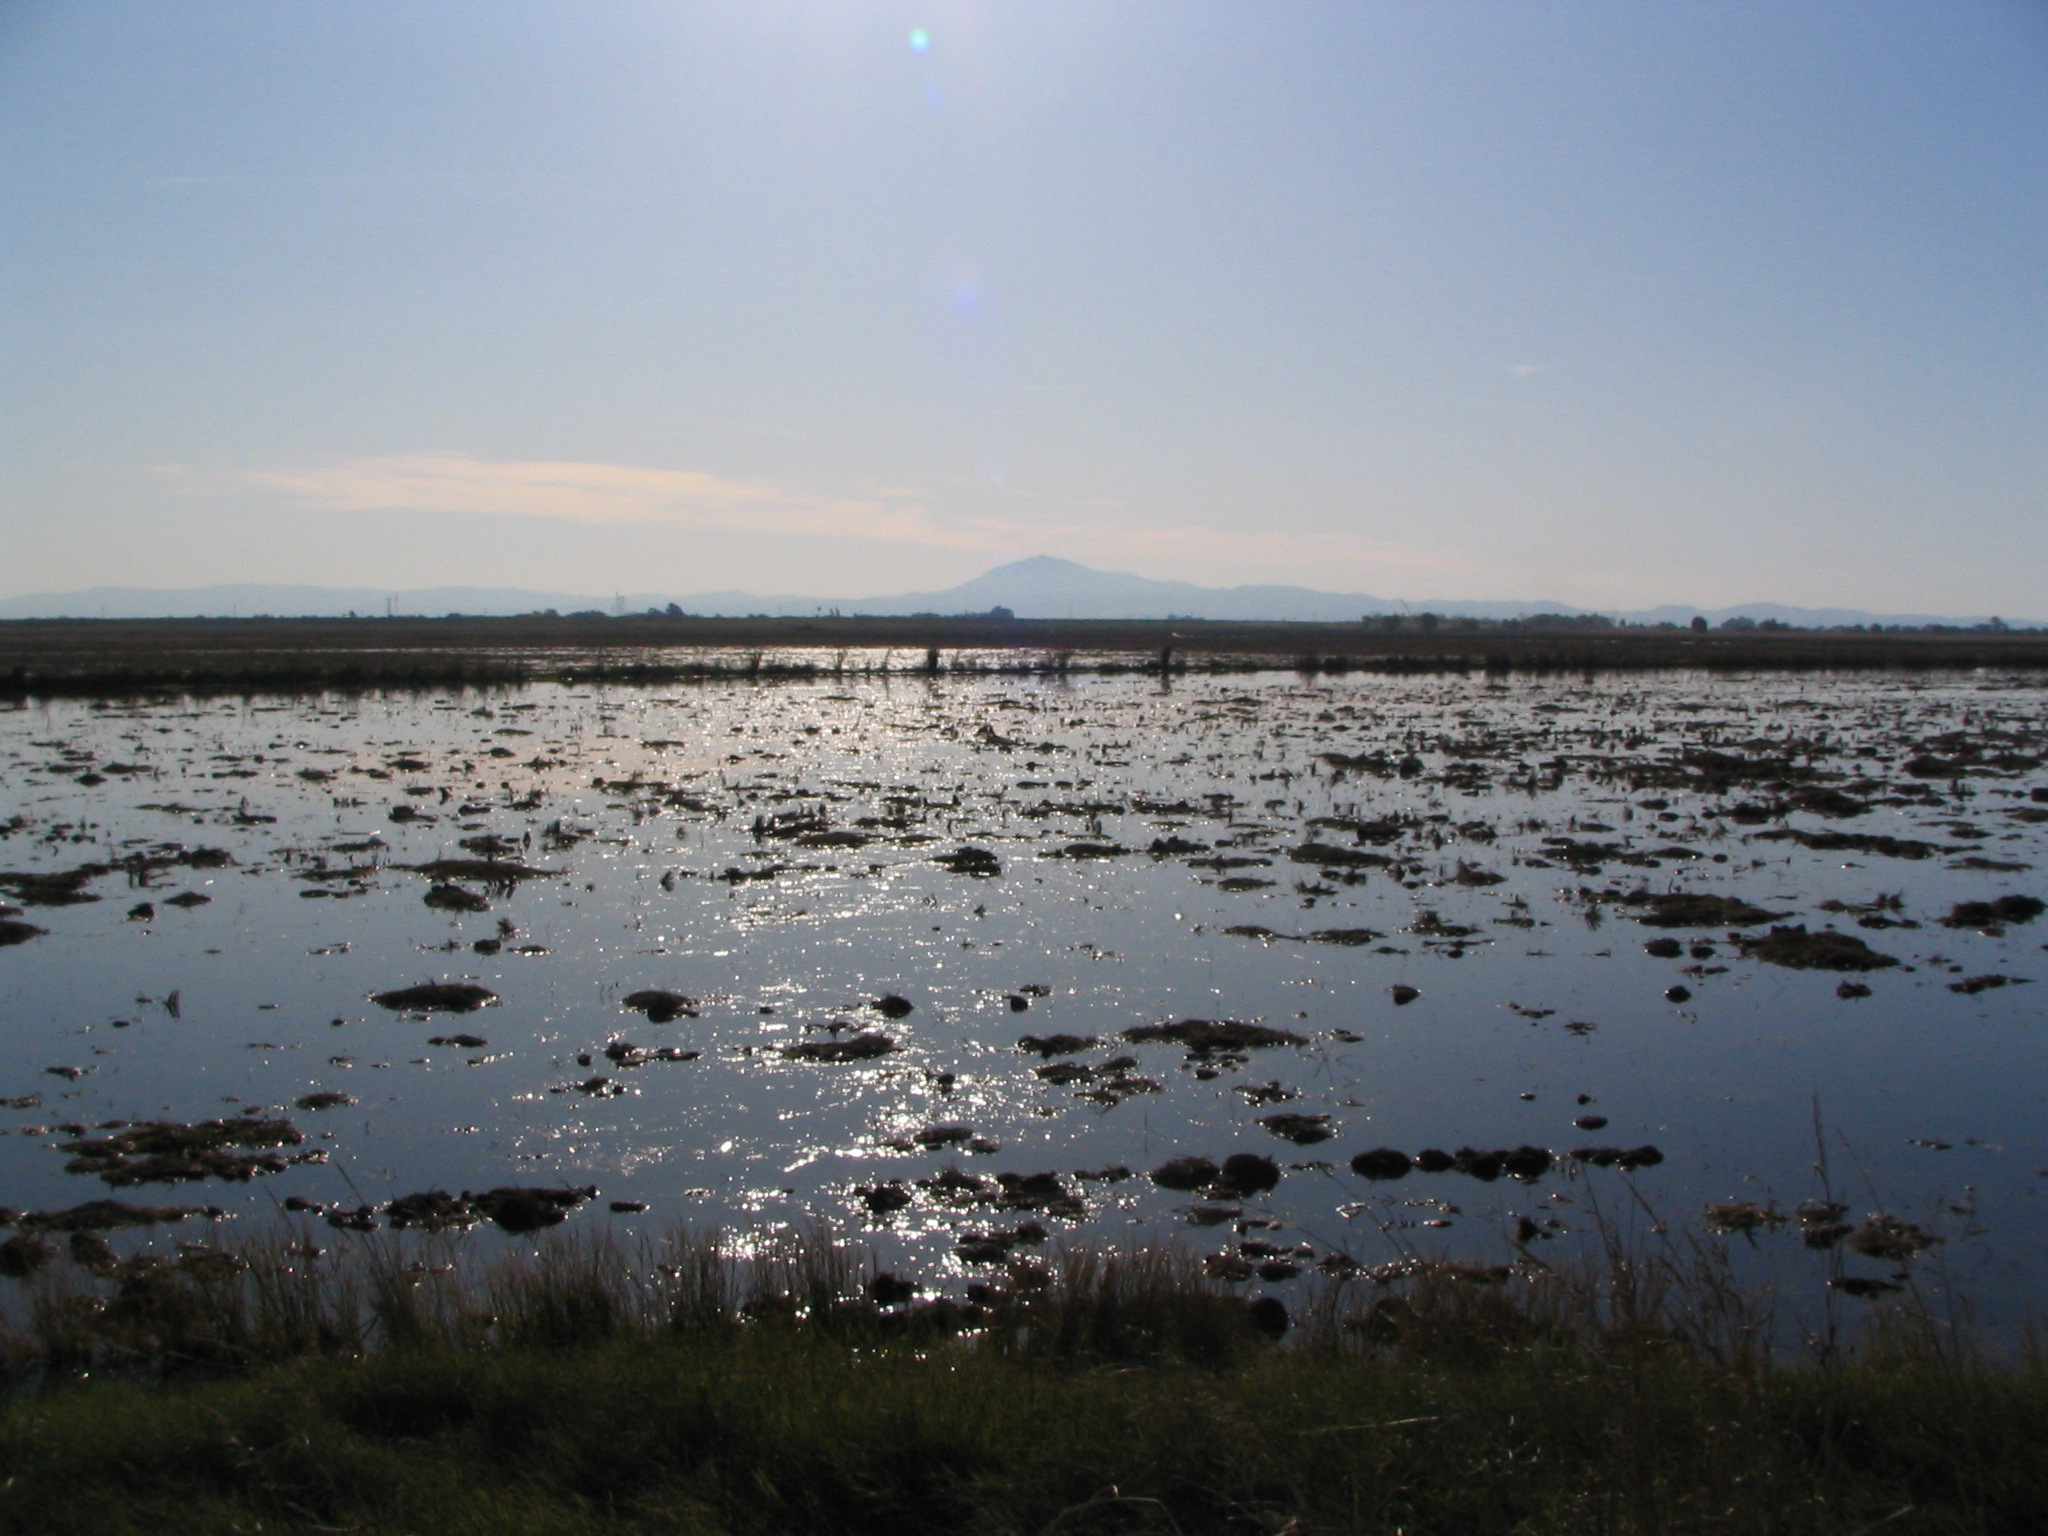
20091119TW_BermWaterMtDiablo.jpg ( 2009-11-19 15:10:29 ) Full size: 2048x1536
View of Mt Diablo over flooded fallow rice paddy
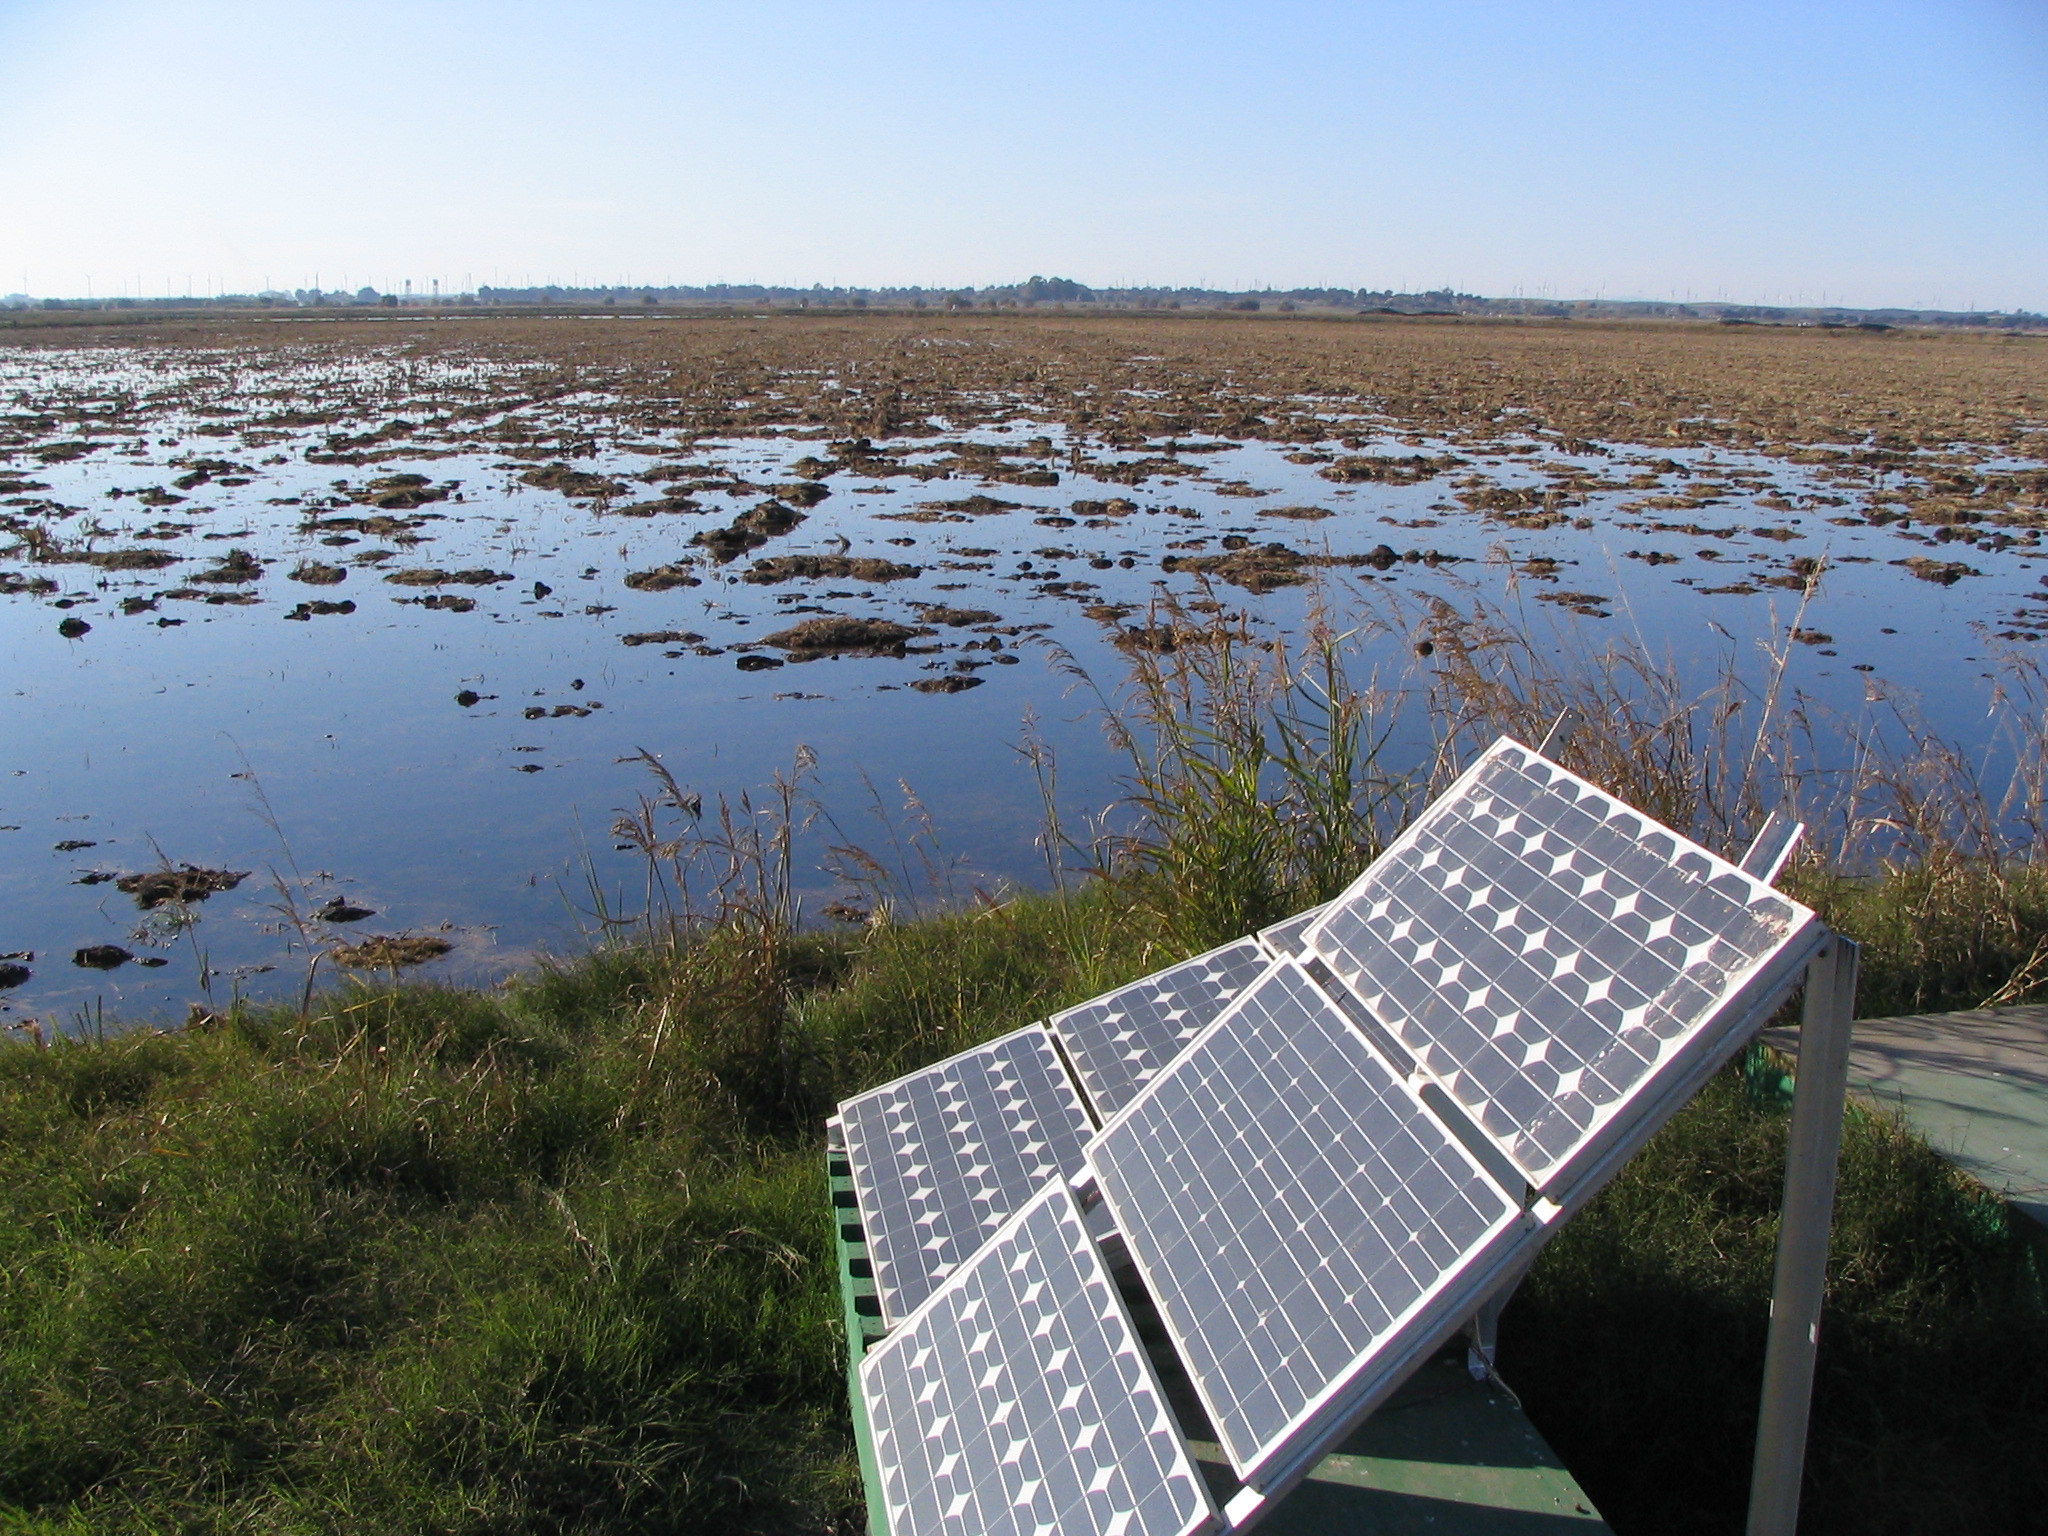
20091119TW_EndBermWater.jpg ( 2009-11-19 15:10:18 ) Full size: 2048x1536
Solar panels and flooded rice field

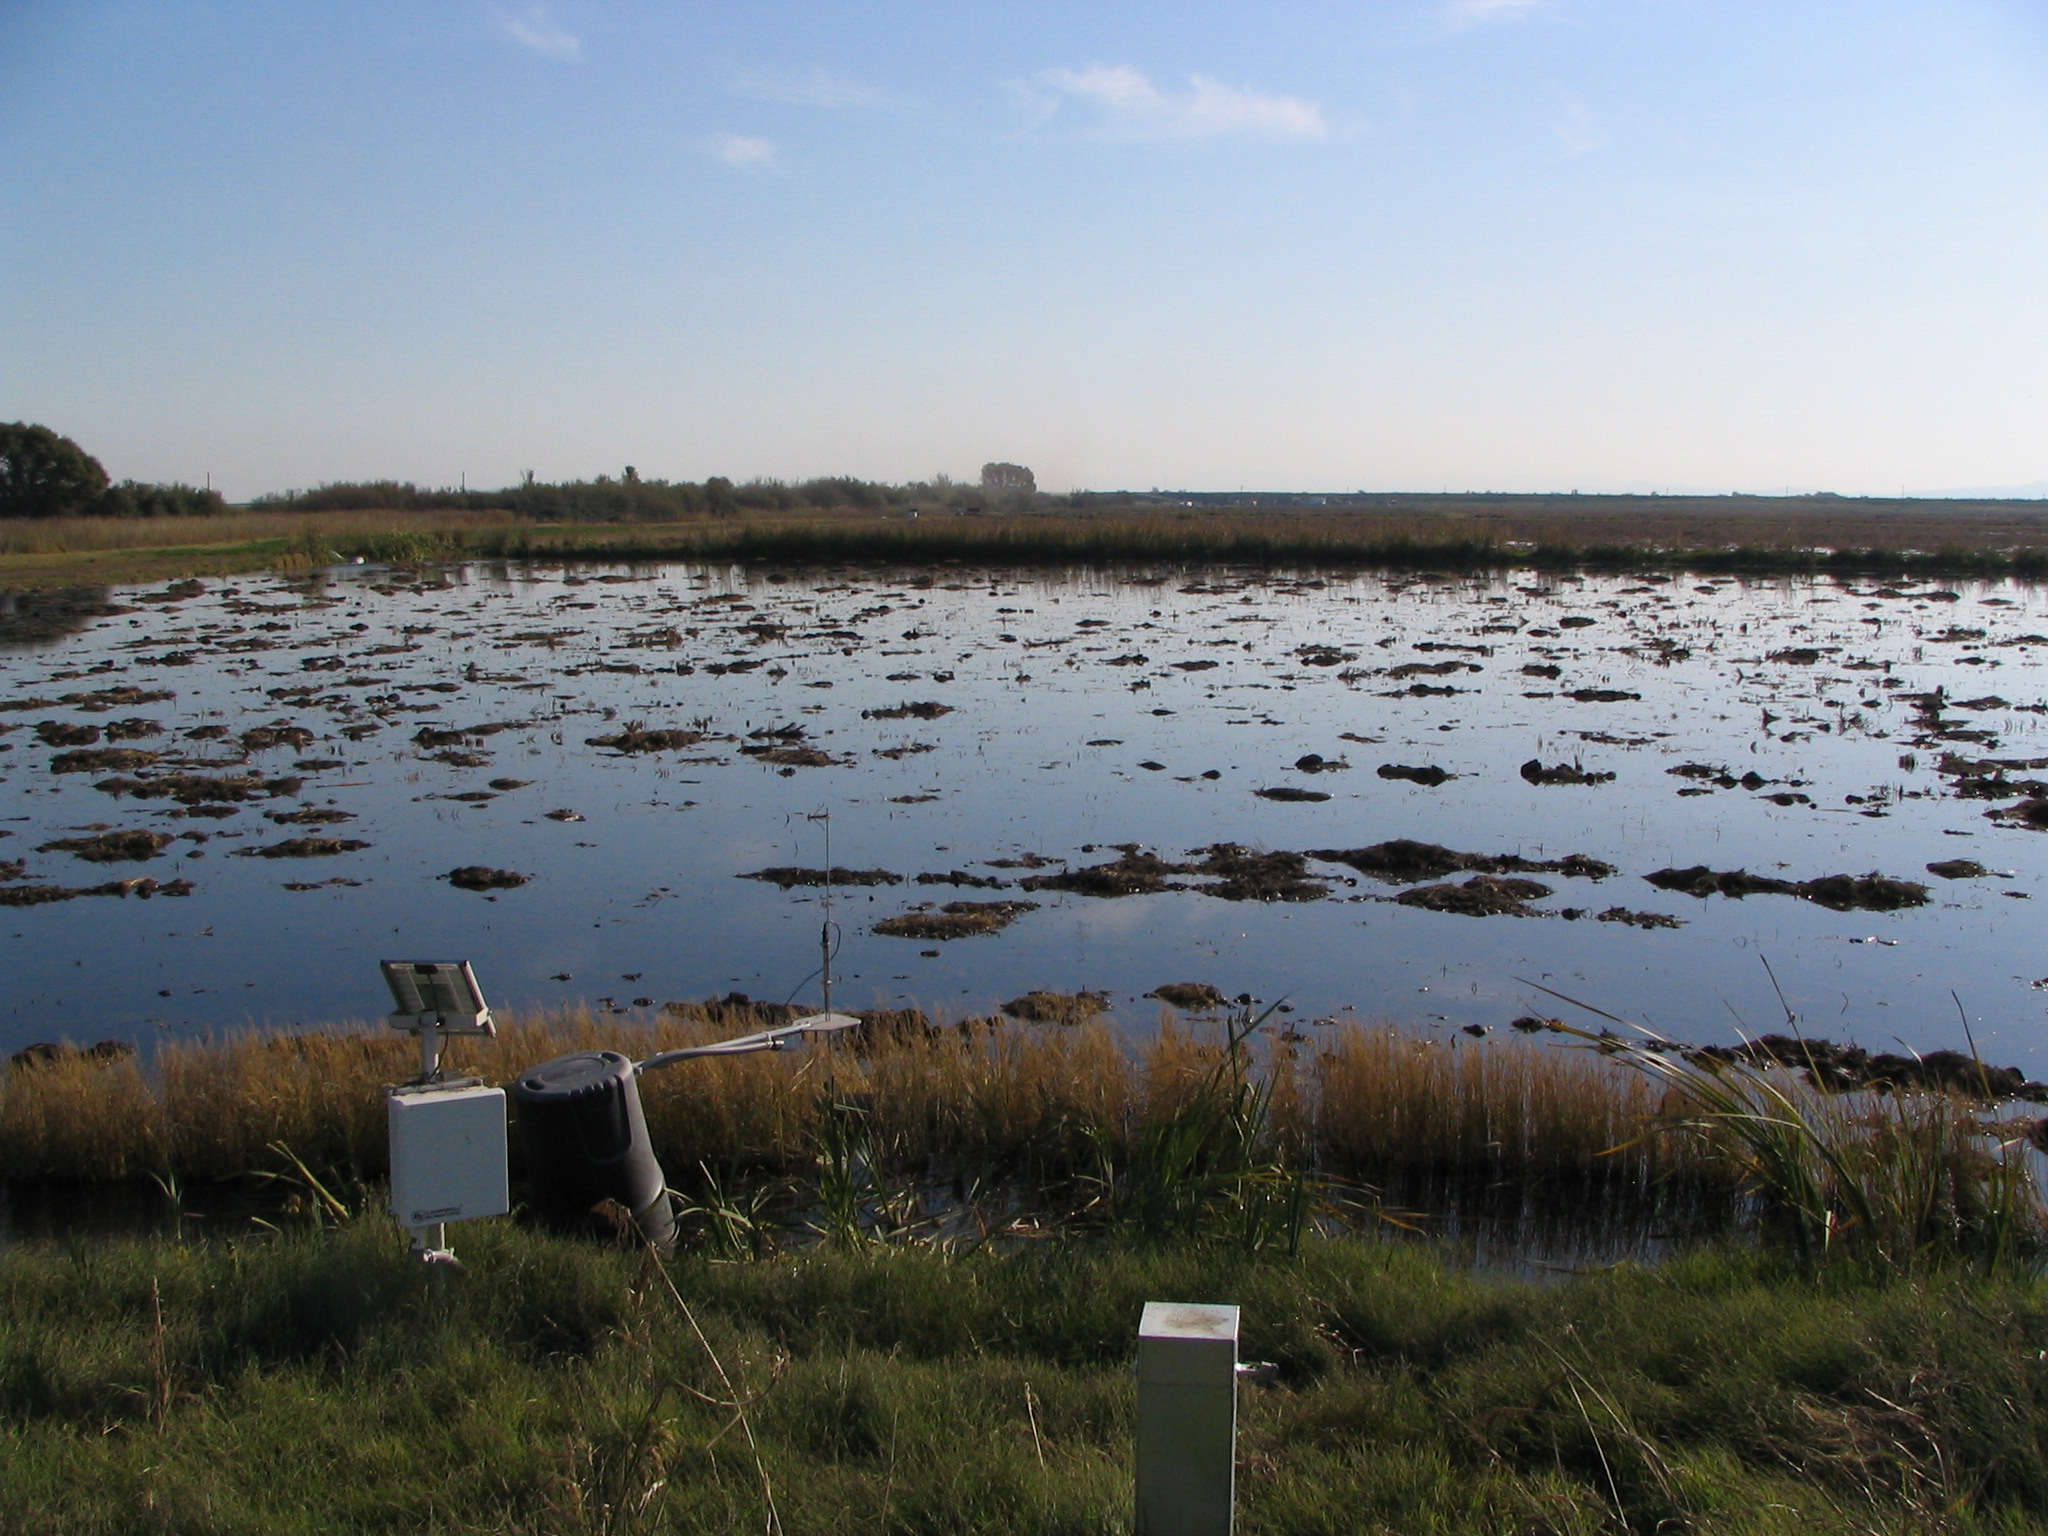
20091119TW_FieldWaterNearTower.jpg ( 2009-11-19 15:04:28 ) Full size: 2048x1536
Some water ponding in the fallow rice field
20091119TW_OldFTowerLocWater.jpg ( 2009-11-19 15:10:11 ) Full size: 2048x1536
Flooded fallow rice paddy

20091119TW_SoilSensors1.jpg ( 2009-11-19 15:04:52 ) Full size: 2048x1536
Water level well in harvested, chopped and disked rice field

20091119TW_SoilSensors2.jpg ( 2009-11-19 15:04:58 ) Full size: 2048x1536
Soil moisture probe in harvested, chopped and disked rice field

20091119TW_Tower.jpg ( 2009-11-19 15:05:22 ) Full size: 2048x1536
Rice tower an fallow field in late afternoon
6 sets found
12 TW_met graphs found
5 TW_flux graphs found
Can't check TWSI_mixed
Can't check SIMBTWEE_met
1 TW_cam graphs found
Can't check TATWBABCSB_cam