
Field Notes
<--2019-06-04 11:24:00 | 2019-06-20 13:10:00-->Other sites visited today: East End | Vaira | Tonzi | Tonzi
Phenocam link: Searching...
East Pond: 2019-06-13 09:30:00 (DOY 164)
Author: Daphne Szutu
Others: Kuno, Robert, Camilo, Jiangong
Summary: Cut and harvested vegetation in footprint, downloaded data, cleaning
| 2019-06-13 East Pond Kuno, Robert, Camilo, Jiangong, and I arrived around 9:30 PDT. It was a mild and sunny with clear skies and a strong breeze--a relief from the 100F+ temperatures from earlier this week. The water level sensors were half submerged. The water level was 54 cm. We cleaned the flux sensors. There was a flickering 7700 error, so I re-started the box, which seemed to fix it. I downloaded photos from the Picam and changed the interval to 1 minute. Bryan had let us borrow a skiff for this experiment. At first, the four of us got in the boat and Kuno tried to push us, but it was too heavy. We had two sets of waders, so Kuno, Camilo, and Robert took turns with the waders to push the rest of us in the boat. We cut most of the tule and cattails within 40m W of the tower. We tried to pick up most of the litter--about 1/3 we brought back and dumped on the levee road. To avoid more soil disturbance in our footprint, we dumped the other 2/3 in an open patch about 42m W from the tower, in what we guessed was beyond our footprint. We found 3 birds' nests built into the reeds, and a few small (50cm-1m diameter) floating mats of roots and soil. Lots of azolla (mosquito fern) and creeping water primrose. Kuno took 10 clip plot measurements - 5 for cattail and 5 for tule. We finished cutting around 13:30 PDT. I downloaded USB and met data. The met data seems to have a gap for almost 2 days, 2019-06-06 to 2019-06-08, and I'm not sure why because power looked fine. eosCO2 value looks a lot noisier after the datalogger came back on, but we forgot to bring the toolbox, so I couldn't fix it. I downloaded the picam photos and changed the photo interval back to 30-minute. LI-7500 readings: CO2 415ppm --> 417 after cutting H2O 665ppm --> 650 after cutting T 22.7C --> 26.3 after cutting P 101.3kPa --> 101.3 after cutting SS 104--> 106 after cleaning --> 106 after cutting LI7700 readings: CH4 1.92ppm --> 1.90 after cutting RSSI 51--> 72 after cleaning --> 67 after cutting [Kuno et al. - more notes] |
6 photos found

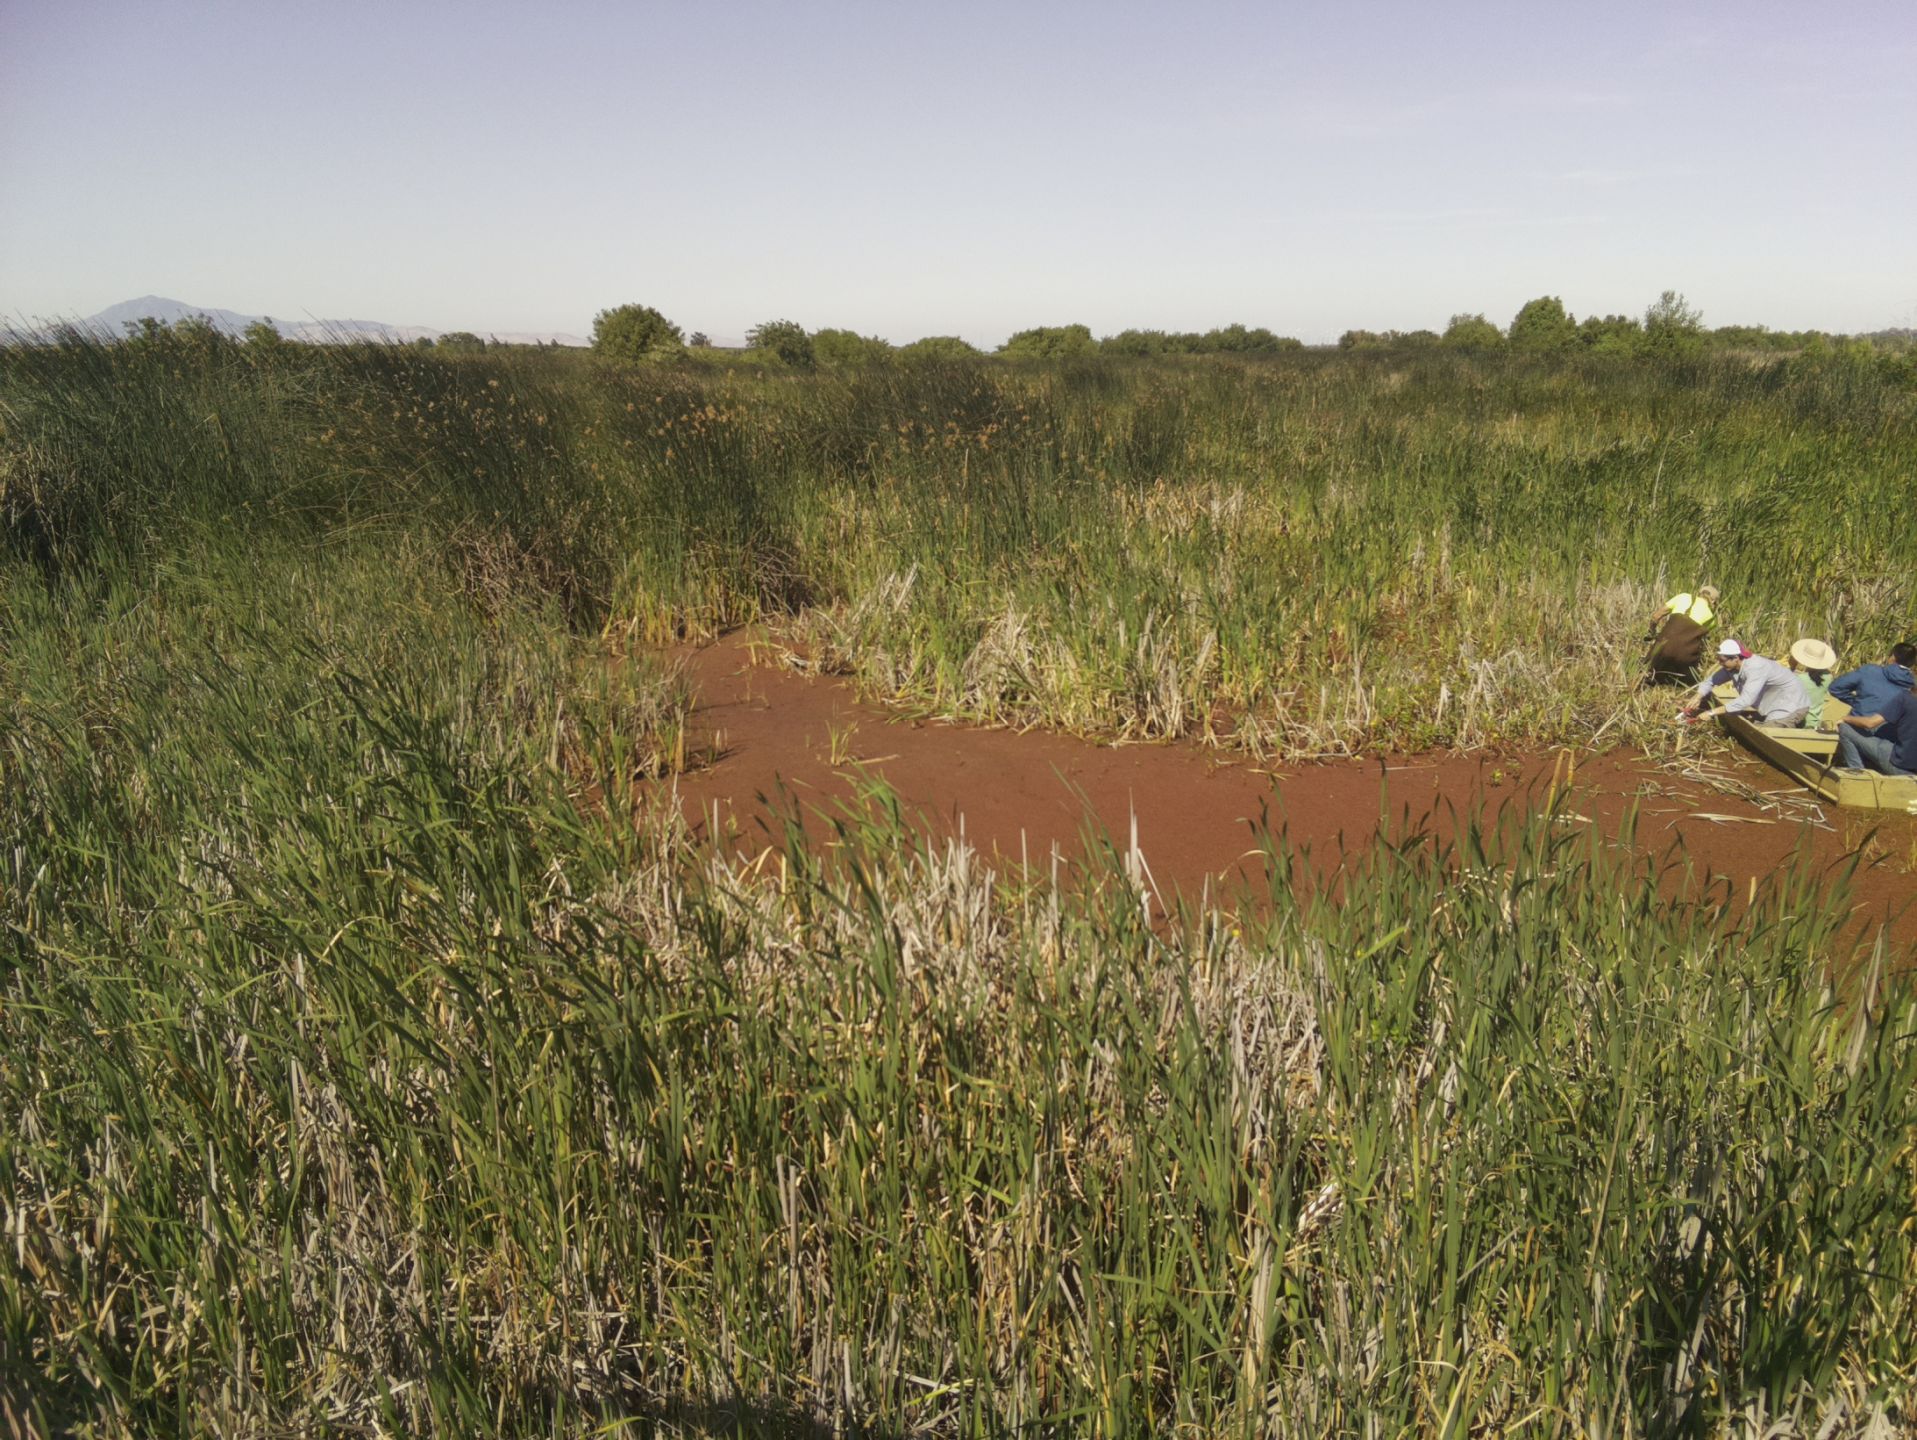
20190613EP_Cutting.JPG ( 2019-06-13 13:28:56 ) Full size: 1920x1440
East Pond after the cutting and harvest.
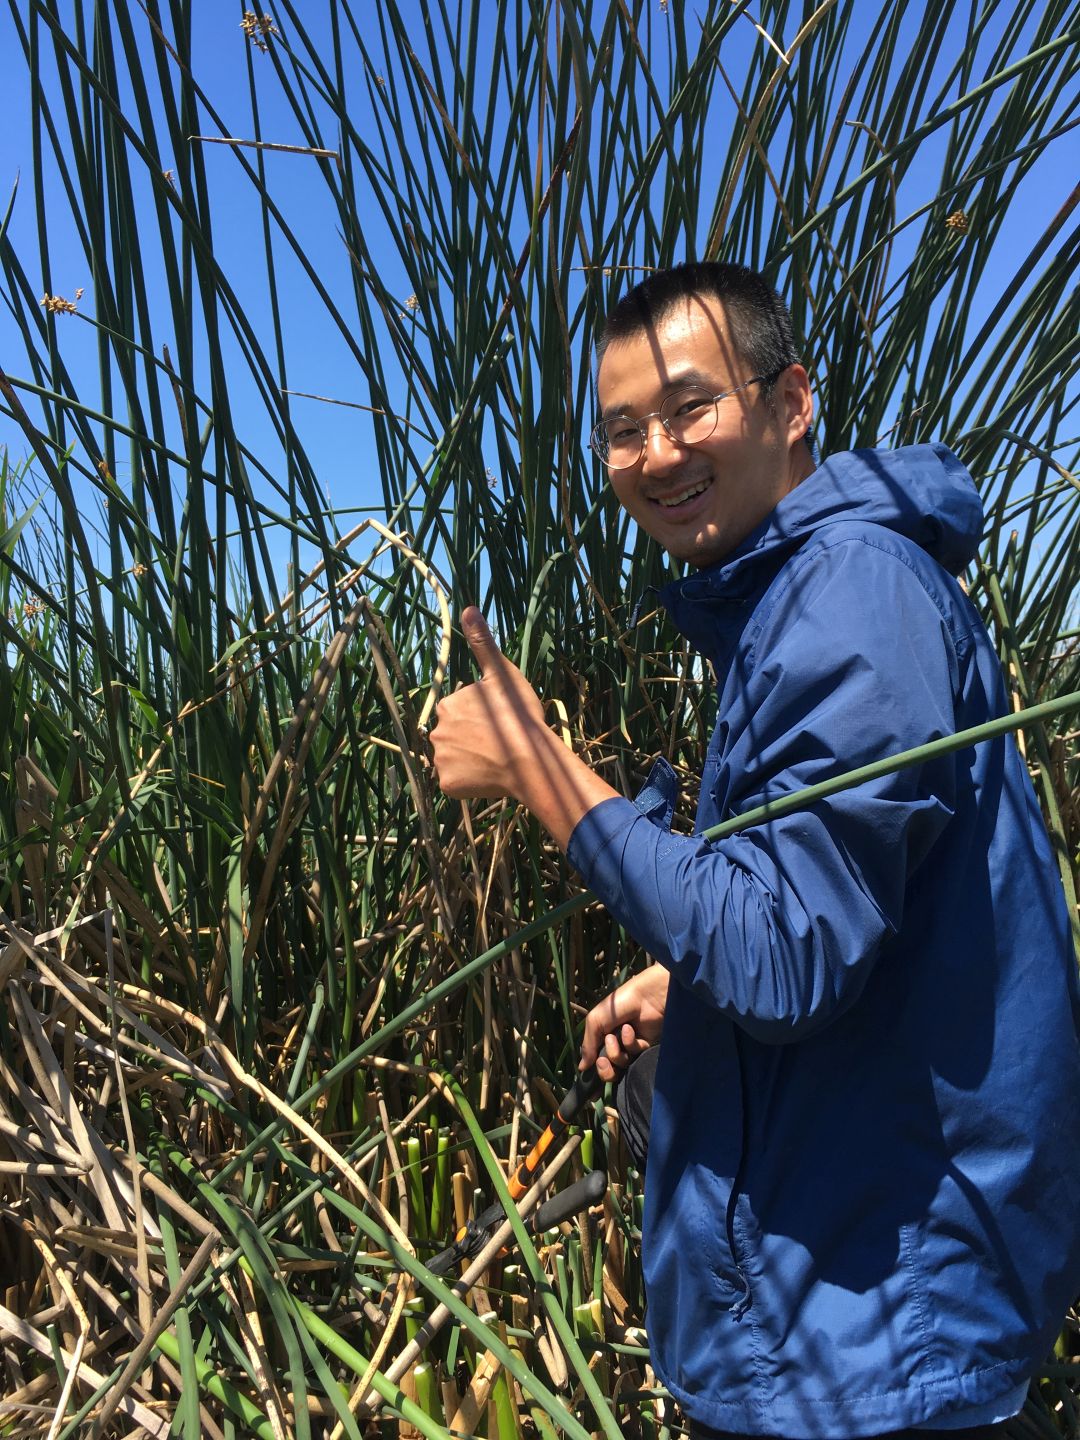
20190613EP_Jiangong.JPG ( 2019-06-13 11:26:42 ) Full size: 1080x1440
Jiangong cutting tules at East Pond.

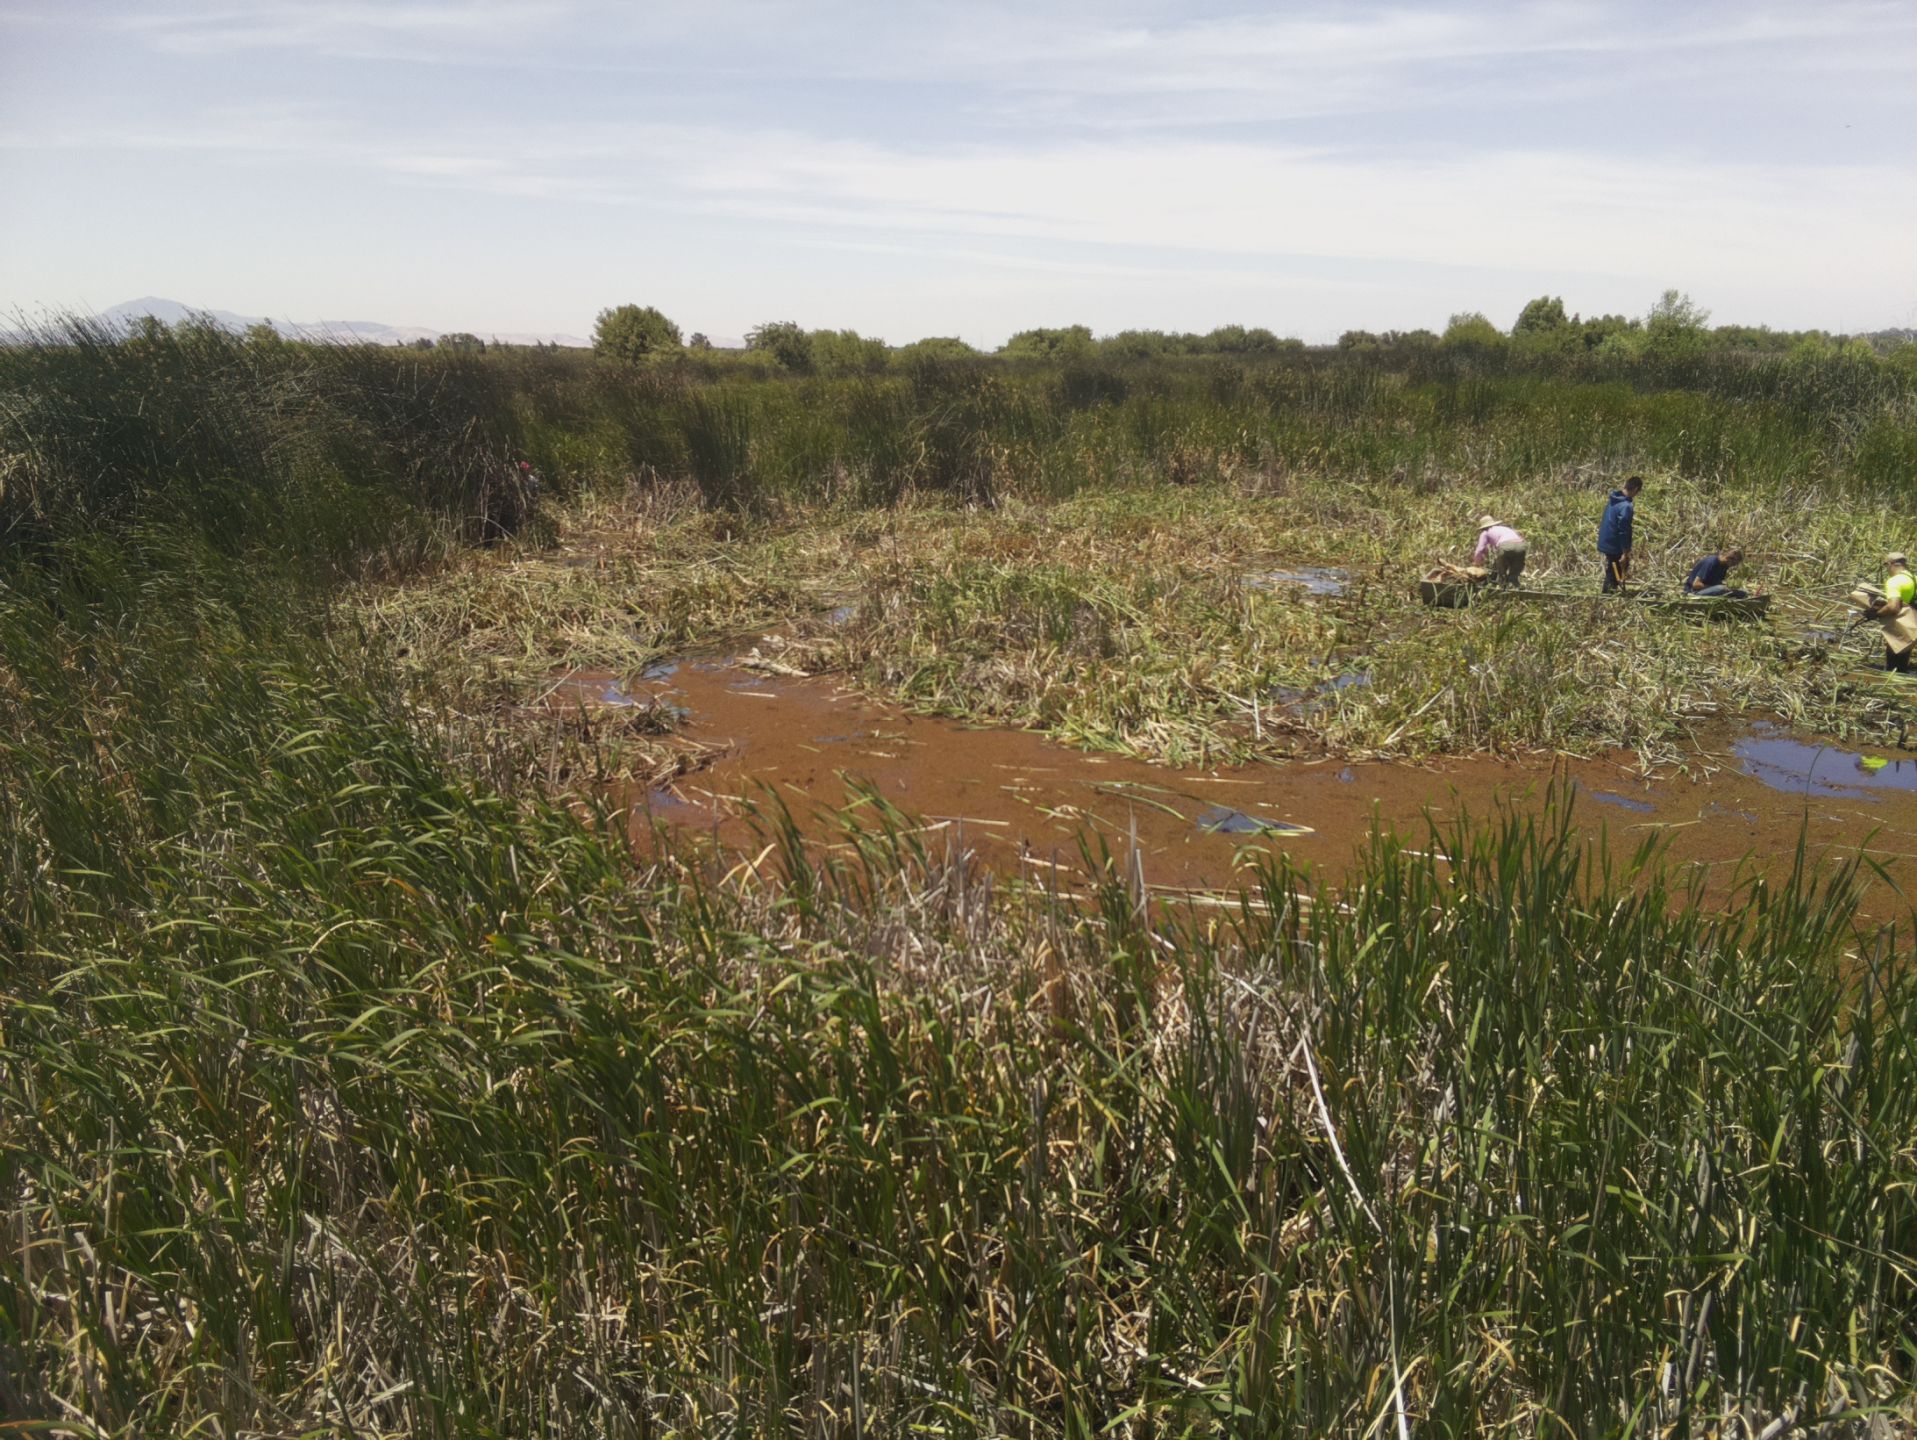
20190613EP_LeafCutters.JPG ( 2019-06-13 11:27:16 ) Full size: 1920x1440
Robert, Kuno, and Camilo cutting tules and cattail at East pond. The skiff is under Kuno's feet, hidden by the harvested plant material.
EP_picam_20190613_0845.JPG ( 2019-06-13 08:45:11 ) Full size: 1917x1440
Beginning of biomass harvest experiement

EP_picam_20190613_1015.JPG ( 2019-06-13 10:15:07 ) Full size: 1917x1440
Biomass harvest experiment
EP_picam_20190613_1145.JPG ( 2019-06-13 11:45:04 ) Full size: 1917x1440
Biomass harvest experiment
5 sets found
Can't check MBEEWPSWEPGT_cam
9 EP_met graphs found
4 EP_flux graphs found
Can't check EP_hobo
1 EP_hobo graphs found
Can't check EP_level1
3 EP_level1 graphs found