Field Notes
<--2019-05-23 13:35:00 | 2019-06-04 09:48:00-->Other sites visited today: West Pond | Mayberry
Phenocam link: Searching...
East End: 2019-05-31 12:00:00 (DOY 151)
Author: Joe Verfaillie
Others: Kristen Maines, USGS Drone crew
Summary: Kristen Maines and crew flying CH4 drone in tower footprint, collect autocam images and miniDOT data.
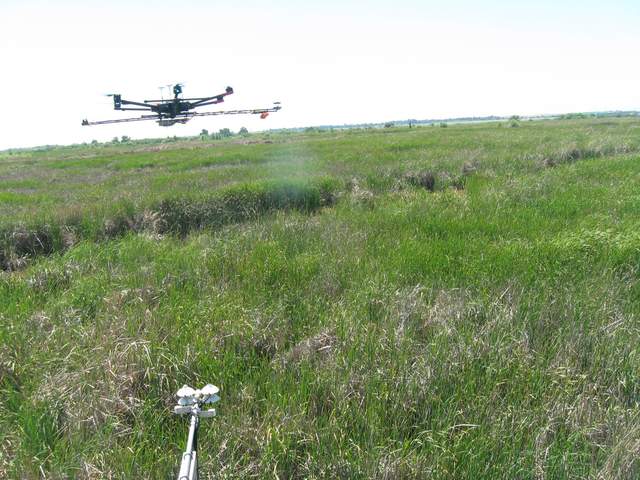
| East End 2019-05-31 I arrived about 12:00. It was clear sunny and hot. Kristen Maines from USGS is here with her crew flying their methane drone upwind of the tower. They started about 10am on the main midline road. A ditch digger was clearing the main drainage ditch near the north end of their transect so they were seeing elevated CH4 at that end. About 1pm they came to the tower and were planning to fly transect curtains (back and forth at different heights) near the edge of footprint upwind and downwind. Before the drone crew arrived I collected the autocam images and miniDOT data that were missed last week. I put some silicone dielectric grease on the o-ring before redeploying the miniDOT. The camera is a pain to deal with. I need to test the one in the lab more to see if I can make it easier to service. The CDHK that is running in the field should be on the field laptop. About 1:30 just before they started flying near the tower I cleaned the 7700 mirrors. Before cleaning RSSI was 41 after it was about 80. Seemed to be a lot of pollen on the bottom mirror. I left soon after. |
1 photos found

EE_autocam_20190531_1330.jpg ( 2019-05-31 13:30:00 ) Full size: 1920x1440
USGS/NASA CH4 drone
11 sets found
14 EE_met graphs found
Can't check EE_mixed
1 EE_mixed graphs found
8 EE_flux graphs found
Can't check MBWPEESWGT_mixed
1 EE_cam graphs found
Can't check MBEEWPSWEPGT_cam
Can't check SIMBTWEE_met
Can't check EE_Temp
5 EE_Temp graphs found
Can't check EE_minidot
1 EE_minidot graphs found
Can't check MBSWEEWPBCBA
1 EE_processed graphs found

