
Field Notes
<--2019-05-07 09:00:00 | 2019-05-30 10:30:00-->Other sites visited today: Tonzi
Phenocam link: Searching...
Vaira: 2019-05-14 14:00:00 (DOY 134)
Author: Joe Verfaillie
Others: Daphne
Summary: Standard fieldwork, Installed Arable Mark 2, LBL crew ECOSTRESS survey.
| Vaira 2019-05-14 I arrived at about 14:00 with Daphne. It was mild and sunny with clouds moving in from the west with approaching rain for the next week starting tomorrow. The ground is dry and crumbly. A group from LBL will be here later today around 16:00 for a soil moisture survey. See the notes for Tonzi from today for more description. Daphne did the standard fieldwork collecting data, soil moisture, well level, and spectral measurements. Vaira 7500 read: 13:50, CO2 417, H2O 483, T 28.6, P 99.6, SS 99.7 I worked on adding an Arable Mark II prototype sn C002471 to the radiation boom. I attached a 1†PVC pipe extending to the west to the boom below the back edge of the radiation platform. I remounted the existing Arable Mark I and then mounted the new Mark 2 to the pipe. The pipe should be replaced with a slightly longer metal pipe. Otherwise all seems well. |
Field Data
No tank data
Well Depth
| Date | Location | Depth (feet) |
|---|---|---|
| 2019-05-14 | TZ_road | 23.05 |
| 2019-05-14 | TZ_tower | 18.07 |
| 2019-05-14 | TZ_floor | 13.63 |
| 2019-05-14 | VR_well | 49.13 |
mode = both
Moisture Point Probes TZ
Array
(
[0] => Tower_1
[1] => Floor_South_1
[2] => Floor_West_1
[3] => Soil_Transect_4_1
[4] => Soil_Transect_2_1
[5] => Soil_Transect_1_1
[6] => SoilCO2_West_A_1
[7] => SoilCO2_West_B_1
[8] => SoilCO2_West_C_1
[9] => Tower_2
[10] => Floor_South_2
[11] => Floor_West_2
[12] => Soil_Transect_4_2
[13] => Soil_Transect_2_2
[14] => Soil_Transect_1_2
[15] => SoilCO2_West_A_2
[16] => SoilCO2_West_B_2
[17] => SoilCO2_West_C_2
[18] => Tower_3
[19] => Floor_South_3
[20] => Floor_West_3
[21] => Soil_Transect_4_3
[22] => Soil_Transect_3_3
[23] => Soil_Transect_2_3
[24] => Soil_Transect_1_3
[25] => SoilCO2_West_A_3
[26] => SoilCO2_West_B_3
[27] => SoilCO2_West_C_3
[28] => Tower_4
[29] => Floor_South_4
[30] => Floor_West_4
[31] => Soil_Transect_4_4
[32] => Soil_Transect_3_4
[33] => Soil_Transect_2_4
[34] => Soil_Transect_1_4
[35] => SoilCO2_West_A_4
[36] => SoilCO2_West_B_4
[37] => SoilCO2_West_C_4
[38] => Soil_Transect_3_1
[39] => Soil_Transect_3_2
)
| Date | DOY | Rep | Depth | Tower_1 |
Floor_South_1 |
Floor_West_1 |
Soil_Transect_4_1 |
Soil_Transect_2_1 |
Soil_Transect_1_1 |
SoilCO2_West_A_1 |
SoilCO2_West_B_1 |
SoilCO2_West_C_1 |
Tower_2 |
Floor_South_2 |
Floor_West_2 |
Soil_Transect_4_2 |
Soil_Transect_2_2 |
Soil_Transect_1_2 |
SoilCO2_West_A_2 |
SoilCO2_West_B_2 |
SoilCO2_West_C_2 |
Tower_3 |
Floor_South_3 |
Floor_West_3 |
Soil_Transect_4_3 |
Soil_Transect_3_3 |
Soil_Transect_2_3 |
Soil_Transect_1_3 |
SoilCO2_West_A_3 |
SoilCO2_West_B_3 |
SoilCO2_West_C_3 |
Tower_4 |
Floor_South_4 |
Floor_West_4 |
Soil_Transect_4_4 |
Soil_Transect_3_4 |
Soil_Transect_2_4 |
Soil_Transect_1_4 |
SoilCO2_West_A_4 |
SoilCO2_West_B_4 |
SoilCO2_West_C_4 |
Soil_Transect_3_1 |
Soil_Transect_3_2 |
Avg | Spacial Count |
Measurement Count |
|---|---|---|---|---|---|---|---|---|---|---|---|---|---|---|---|---|---|---|---|---|---|---|---|---|---|---|---|---|---|---|---|---|---|---|---|---|---|---|---|---|---|---|---|---|---|---|
| 2019-05-14 | 134 | 0 | nan | 7.4 | 6.8 | 10.3 | 2.5 | 7.1 | 5 | 8.8 | 8 | 5 | 16.1 | 9.7 | 12.7 | 10.3 | 17.6 | 6.9 | 13 | 0.8 | 15.2 | 19.8 | 20.7 | 39.6 | 12.9 | 19.9 | 22.3 | 18.7 | 22.9 | 18.4 | 22.1 | 29.1 | 28.2 | 41.1 | 18.2 | 30.8 | 37.7 | 16.2 | 32.2 | 28.5 | 34.5 | |||||
| 2019-05-14 | 134 | 1 | nan | 7.7 | 7.1 | 11.1 | 1.6 | 6.8 | 5 | 8.6 | 8.3 | 3.6 | 15.2 | 10 | 13.3 | 11.2 | 17.6 | 6.6 | 13.3 | 1.1 | 14.2 | 20.4 | 19.8 | 13.7 | 19.8 | 22.9 | 19.3 | 22.3 | 17.9 | 22.3 | 28.8 | 28.8 | 17 | 31.1 | 38 | 17 | 33.7 | 27.1 | 34.8 | 5 | 16.4 | |||||
| 2019-05-14 | 134 | 2 | nan | 19.8 | 31.4 | 5 | 16.4 | |||||||||||||||||||||||||||||||||||||||
| 2019-05-14 | 134 | Avg | 0-15cm | 0 | 0 | |||||||||||||||||||||||||||||||||||||||||
| 2019-05-14 | 134 | Avg | 15-30cm | 0 | 0 | |||||||||||||||||||||||||||||||||||||||||
| 2019-05-14 | 134 | Avg | 30-45cm | 0 | 0 | |||||||||||||||||||||||||||||||||||||||||
| 2019-05-14 | 134 | Avg | 45-60cm | 0 | 0 |
mode = both
Moisture Point Probes VR
Array
(
[0] => Solar_Panels_1
[1] => Flux_Tower_1
[2] => Biomass_Cage_1
[3] => Solar_Panels_2
[4] => Flux_Tower_2
[5] => Biomass_Cage_2
[6] => Solar_Panels_3
[7] => Flux_Tower_3
[8] => Biomass_Cage_3
[9] => Solar_Panels_4
[10] => Flux_Tower_4
[11] => Biomass_Cage_4
)
| Date | DOY | Rep | Depth | Solar_Panels_1 |
Flux_Tower_1 |
Biomass_Cage_1 |
Solar_Panels_2 |
Flux_Tower_2 |
Biomass_Cage_2 |
Solar_Panels_3 |
Flux_Tower_3 |
Biomass_Cage_3 |
Solar_Panels_4 |
Flux_Tower_4 |
Biomass_Cage_4 |
Avg | Spacial Count |
Measurement Count |
|---|---|---|---|---|---|---|---|---|---|---|---|---|---|---|---|---|---|---|
| 2019-05-14 | 134 | 0 | nan | 2.4 | 2.7 | 2.4 | 11.5 | 12.1 | 6.6 | 18.2 | 7 | 17.9 | 31.7 | 17.9 | 19.6 | |||
| 2019-05-14 | 134 | 1 | nan | 2.4 | 2.7 | 2.4 | 11.2 | 11.8 | 6.3 | 17.6 | 6.7 | 17.3 | 31.1 | 17 | 19.6 | |||
| 2019-05-14 | 134 | Avg | 0-15cm | 0 | 0 | |||||||||||||
| 2019-05-14 | 134 | Avg | 15-30cm | 0 | 0 | |||||||||||||
| 2019-05-14 | 134 | Avg | 30-45cm | 0 | 0 | |||||||||||||
| 2019-05-14 | 134 | Avg | 45-60cm | 0 | 0 |
No TZ grass heigth found
No VR grass heigth found
No VR Tree DBH found
No water potential data found
No VR Grass Biomass data found
No VR OakLeaves Biomass data found
No VR PineNeedles Biomass data found
1 photos found
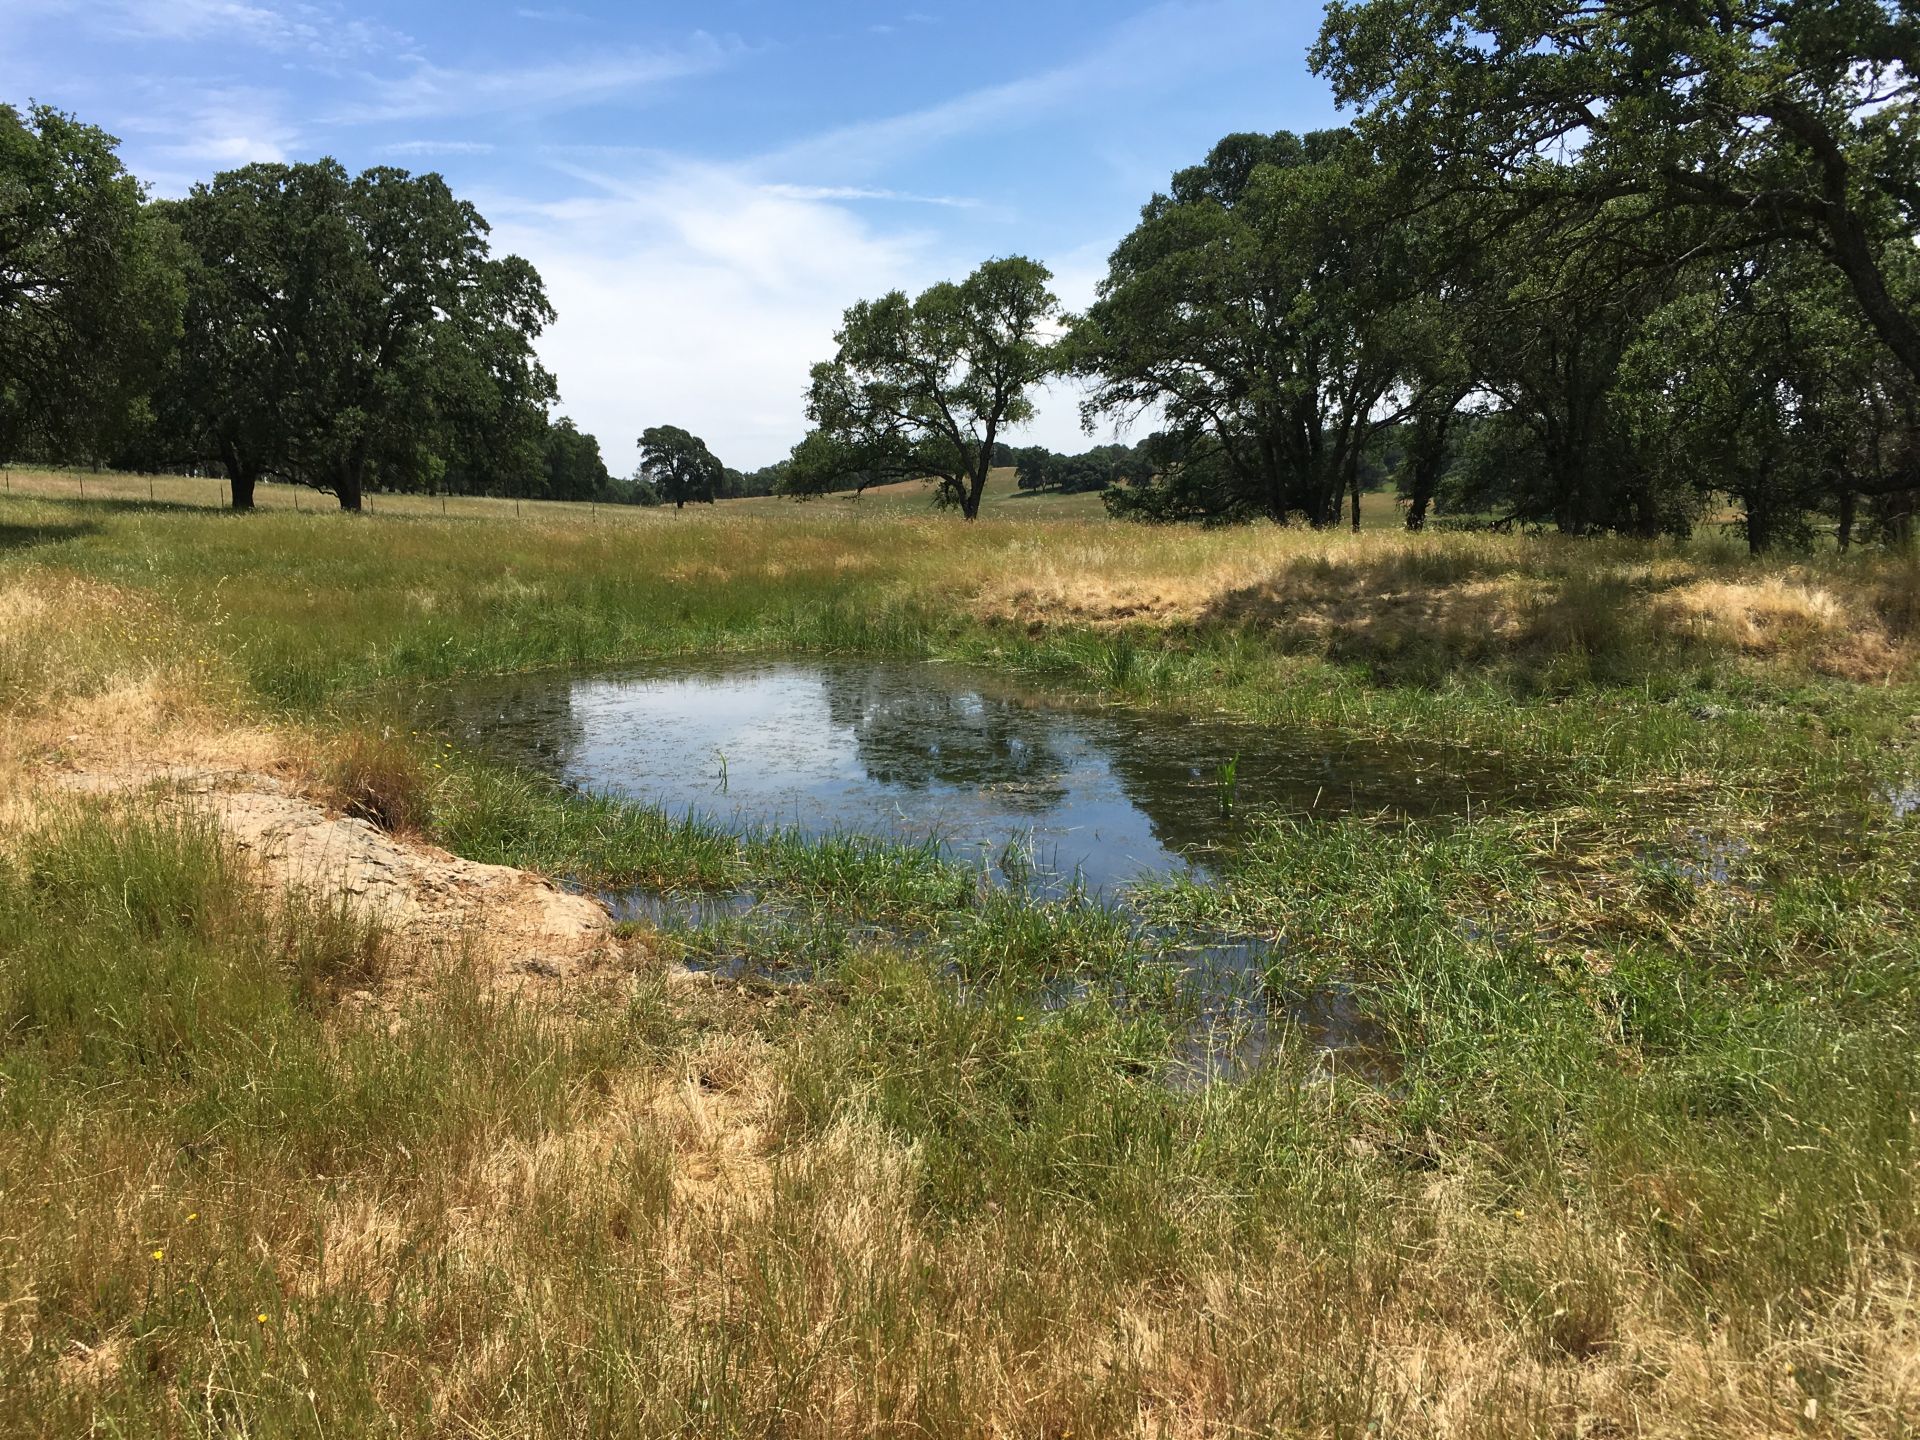
20190514VR_Wateringhole.JPG ( 2019-05-14 13:48:10 ) Full size: 1920x1440
Watering hole at Vaira. Grass is starting to turn brown.
9 sets found
16 VR_met graphs found
2 VR_flux graphs found
6 VR_soilco2 graphs found
2 VR_pond graphs found
Can't check TZVR_mixed
No data found for VR_fd.
No data found for VR_processed.
4 VR_arable graphs found
No data found for VR_soilvue.