
Field Notes
<--2018-10-29 10:00:00 | 2018-11-14 00:00:00-->Other sites visited today: Bouldin Alfalfa | Vaira
Phenocam link: Searching...
Tonzi: 2018-11-07 11:30:00 (DOY 311)
Author: Joe Verfaillie
Others:
Summary: Check Floor batteries, soilco2 power, temp fences around Floor, retested OSU SP2 and SP3 rain buckets, checked on FLIR system, cleaned Phenocam window.
| Tonzi 2018-11-07 I arrived at about 11:30. It was warm and dry with a cool wind from the west. The pond is about as low as I have ever seen it. The cows have eaten everything green. I checked on the Floor battery bank that had failed last time out due to one bad battery which was removed. The bank was at 13V and sucking down 10A from the panels. I checked the data on the CR200 and it seemed the battery voltage has stayed above 12V and there was no more missing data. I think the batteries are good to go for now. The cows had pulled the cable to z-cam 3 loose. I was able to plug it back together and the camera tested okay. I pounded in a couple new fence posts and made a small fence around the tower and z-cam. It is not electrified but might keep the cows out for now. I did the same around the solar panels. I’ll put barbed wire on both of these. Power at the soil co2 system also seemed okay after the repairs last week. The tree CO2 probes seem to be continuously on but I could not see any problems with the wiring. The relay may be stuck or broken. I can replace it next time. I retested the OSU SP2 and SP3 tipping buckets. SP2 got 93/100 tips and I gave it two turns CW. I think it is good. SP3 got 100/100 tips. I cleaned the Tower Phenocam window inside and out and the camera lens. I might have changed the FOV a little having to move the camera. The FLIR system seemed to be running okay. I restarted the computer. I tried to take some photos of the black body by hanging it in front of the camera on a pole. The black body in the sun and its temperature was slowly rising from 29.4 to 29.6 as I took two photos. It was also swinging a little as the wind was blowing. I did not check the FLIR’s clock because the LattePanda controls when a photo is taken and puts the time stamp in the file name. The LattePanda clock was okay as was the clock on the CR10x that records the cal panel IRT data. I was thinking about moving the IRT over to the Floor solar panels but ran out of time. I did swap the battery for the IRT system. The thermocouple on the outside of the FLIR window has fallen off and is just dangling in the air. |
Field Data
No tank data
No TZ Well data found
No TZ Moisture Point data found
No VR Moisture Point data found
No TZ grass heigth found
No VR grass heigth found
No TZ Tree DBH found
No water potential data found
No TZ Grass Biomass data found
No TZ OakLeaves Biomass data found
No TZ PineNeedles Biomass data found
1 photos found
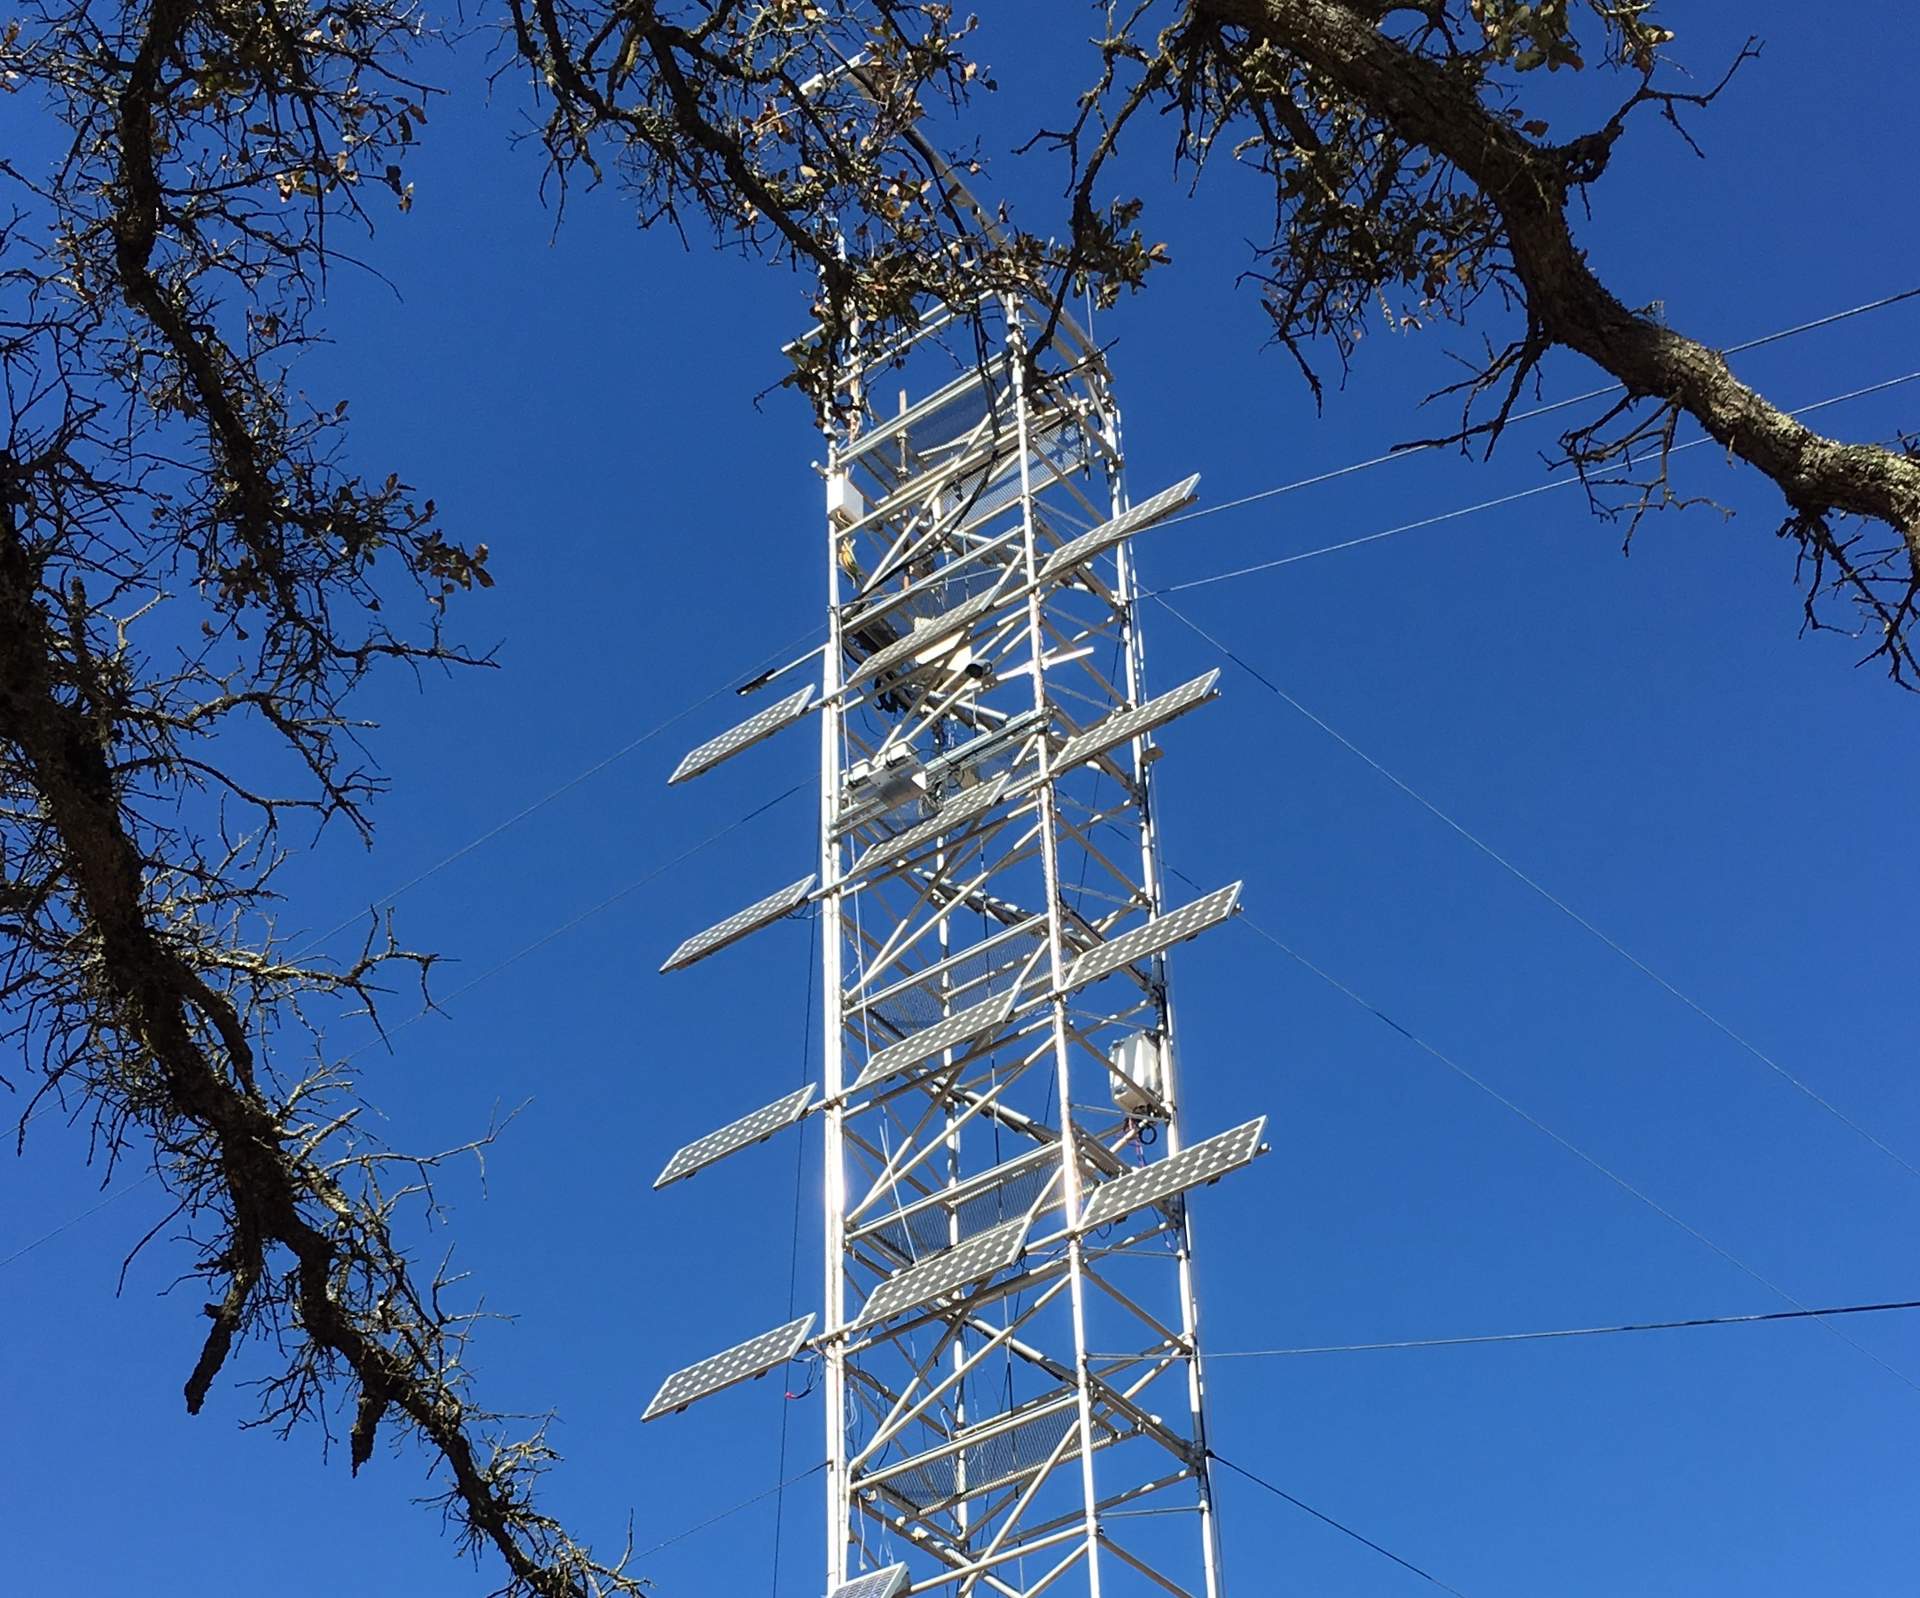
20181107TZ_JPLEquipOnTower.jpg ( 2018-11-07 11:58:46 ) Full size: 1920x1598
JPL equipment just visible on the Tower above the second from top solar panel
16 sets found
No data found for TZ_Fenergy.
11 TZ_tmet graphs found
11 TZ_soilco2 graphs found
Can't check TZ_mixed
3 TZ_mixed graphs found
1 TZ_fflux graphs found
8 TZ_fmet graphs found
No data found for TZ_tram.
3 TZ_co2prof graphs found
1 TZ_irt graphs found
No data found for TZ_windprof.
1 TZ_tflux graphs found
2 TZ_sm graphs found
Can't check TZ_met
1 TZ_met graphs found
Can't check TZVR_mixed
8 TZ_osu graphs found
No data found for TZ_fd.
Tonzi Z-cam data