
Field Notes
<--2017-10-25 10:30:00 | 2017-11-29 10:00:00-->Other sites visited today: Tonzi | Tonzi
Phenocam link: Searching...
Vaira: 2017-11-07 10:30:00 (DOY 311)
Author: Joe Verfaillie
Others: Siyan, Dennis
Summary: Standard fieldwork, collected FD data.
| Vaira 2017-11-07 I arrived with Dennis and Siyan at about 10:30. I was clear sunny and mild. There was a little more rain but the ground is still dry. Dennis did the soil moistures. Siyan collected data and did spectral measurements. I collect data from the FD chambers. They look okay. I also checked the clock on the StarDot that was wrong last time. This time is seemed fine. I cleaned some bird poop out of the tipping bucket. |
Field Data
No tank data
Well Depth
| Date | Location | Depth (feet) |
|---|---|---|
| 2017-11-07 | TZ_floor | 27.7 |
| 2017-11-07 | TZ_road | 36.6 |
| 2017-11-07 | TZ_tower | 32.6 |
mode = both
Moisture Point Probes TZ
Array
(
[0] => Tower_1
[1] => Floor_South_1
[2] => Floor_East_1
[3] => Floor_West_1
[4] => Soil_Transect_4_1
[5] => Soil_Transect_3_1
[6] => Soil_Transect_2_1
[7] => Soil_Transect_1_1
[8] => SoilCO2_West_A_1
[9] => SoilCO2_West_B_1
[10] => SoilCO2_West_C_1
[11] => Tower_2
[12] => Floor_South_2
[13] => Floor_East_2
[14] => Floor_West_2
[15] => Soil_Transect_4_2
[16] => Soil_Transect_3_2
[17] => Soil_Transect_2_2
[18] => Soil_Transect_1_2
[19] => SoilCO2_West_A_2
[20] => SoilCO2_West_C_2
[21] => Tower_3
[22] => Floor_South_3
[23] => Floor_East_3
[24] => Floor_West_3
[25] => Soil_Transect_4_3
[26] => Soil_Transect_3_3
[27] => Soil_Transect_2_3
[28] => Soil_Transect_1_3
[29] => SoilCO2_West_A_3
[30] => SoilCO2_West_B_3
[31] => SoilCO2_West_C_3
[32] => Tower_4
[33] => Floor_South_4
[34] => Floor_East_4
[35] => Floor_West_4
[36] => Soil_Transect_4_4
[37] => Soil_Transect_3_4
[38] => Soil_Transect_2_4
[39] => Soil_Transect_1_4
[40] => SoilCO2_West_A_4
[41] => SoilCO2_West_B_4
[42] => SoilCO2_West_C_4
[43] => SoilCO2_West_B_2
)
| Date | DOY | Rep | Depth | Tower_1 |
Floor_South_1 |
Floor_East_1 |
Floor_West_1 |
Soil_Transect_4_1 |
Soil_Transect_3_1 |
Soil_Transect_2_1 |
Soil_Transect_1_1 |
SoilCO2_West_A_1 |
SoilCO2_West_B_1 |
SoilCO2_West_C_1 |
Tower_2 |
Floor_South_2 |
Floor_East_2 |
Floor_West_2 |
Soil_Transect_4_2 |
Soil_Transect_3_2 |
Soil_Transect_2_2 |
Soil_Transect_1_2 |
SoilCO2_West_A_2 |
SoilCO2_West_C_2 |
Tower_3 |
Floor_South_3 |
Floor_East_3 |
Floor_West_3 |
Soil_Transect_4_3 |
Soil_Transect_3_3 |
Soil_Transect_2_3 |
Soil_Transect_1_3 |
SoilCO2_West_A_3 |
SoilCO2_West_B_3 |
SoilCO2_West_C_3 |
Tower_4 |
Floor_South_4 |
Floor_East_4 |
Floor_West_4 |
Soil_Transect_4_4 |
Soil_Transect_3_4 |
Soil_Transect_2_4 |
Soil_Transect_1_4 |
SoilCO2_West_A_4 |
SoilCO2_West_B_4 |
SoilCO2_West_C_4 |
SoilCO2_West_B_2 |
Avg | Spacial Count |
Measurement Count |
|---|---|---|---|---|---|---|---|---|---|---|---|---|---|---|---|---|---|---|---|---|---|---|---|---|---|---|---|---|---|---|---|---|---|---|---|---|---|---|---|---|---|---|---|---|---|---|---|---|---|---|
| 2017-11-07 | 311 | 0 | nan | 3.9 | 3.9 | 6.8 | 3.3 | 0.7 | 3 | 4.2 | 0.1 | 3.1 | 5.6 | 2.2 | 11.8 | 11.5 | 8.4 | 7.8 | 6.9 | 13 | 12.1 | 3.9 | 9 | 11.2 | 13.4 | 6.4 | 11.5 | 10.9 | 9.2 | 12.9 | 15.6 | 13.7 | 16.5 | 15.4 | 12 | 14.5 | 3.3 | 14.5 | 15.6 | 11.6 | 17.9 | 25.6 | 11.6 | 14.5 | 11.3 | 21.9 | ||||
| 2017-11-07 | 311 | 1 | nan | 4.2 | 4.8 | 6.8 | 1.8 | 1 | 1.8 | 3.6 | 0.1 | 3.1 | 5 | 2.8 | 11.8 | 11.8 | 9 | 2.3 | 7.5 | 13 | 12.1 | 3.9 | 8.7 | 11.2 | 14 | 7.6 | 11.5 | 11.2 | 9.2 | 11.5 | 15.5 | 12.9 | 16.8 | 15.4 | 12.9 | 13.9 | 2.2 | 13.9 | 15 | 11.3 | 17.6 | 25.6 | 10.7 | 13.3 | 11.3 | 22.2 | 0.9 | |||
| 2017-11-07 | 311 | 2 | nan | 3.6 | 7.4 | 11.8 | 9.7 | 15.1 | 12.3 | 14.2 | 14.5 | |||||||||||||||||||||||||||||||||||||||
| 2017-11-07 | 311 | 3 | nan | 7.1 | 9.7 | 9.8 | 13.9 | |||||||||||||||||||||||||||||||||||||||||||
| 2017-11-07 | 311 | 4 | nan | 7.4 | 9 | 11.7 | 15.3 | |||||||||||||||||||||||||||||||||||||||||||
| 2017-11-07 | 311 | Avg | 0-15cm | 0 | 0 | |||||||||||||||||||||||||||||||||||||||||||||
| 2017-11-07 | 311 | Avg | 15-30cm | 0 | 0 | |||||||||||||||||||||||||||||||||||||||||||||
| 2017-11-07 | 311 | Avg | 30-45cm | 0 | 0 | |||||||||||||||||||||||||||||||||||||||||||||
| 2017-11-07 | 311 | Avg | 45-60cm | 0 | 0 |
mode = both
Moisture Point Probes VR
Array
(
[0] => Solar_Panels_1
[1] => Flux_Tower_1
[2] => Gate_1
[3] => Biomass_Cage_1
[4] => Solar_Panels_2
[5] => Flux_Tower_2
[6] => Gate_2
[7] => Biomass_Cage_2
[8] => Solar_Panels_3
[9] => Flux_Tower_3
[10] => Gate_3
[11] => Biomass_Cage_3
[12] => Solar_Panels_4
[13] => Flux_Tower_4
[14] => Gate_4
[15] => Biomass_Cage_4
)
| Date | DOY | Rep | Depth | Solar_Panels_1 |
Flux_Tower_1 |
Gate_1 |
Biomass_Cage_1 |
Solar_Panels_2 |
Flux_Tower_2 |
Gate_2 |
Biomass_Cage_2 |
Solar_Panels_3 |
Flux_Tower_3 |
Gate_3 |
Biomass_Cage_3 |
Solar_Panels_4 |
Flux_Tower_4 |
Gate_4 |
Biomass_Cage_4 |
Avg | Spacial Count |
Measurement Count |
|---|---|---|---|---|---|---|---|---|---|---|---|---|---|---|---|---|---|---|---|---|---|---|
| 2017-11-07 | 311 | 0 | nan | 4.2 | 1.2 | 3.6 | 0.6 | 9.7 | 7.5 | 4.8 | 4.8 | 13.7 | 4.5 | 9 | 13.7 | 26.5 | 15 | 10.5 | 16.8 | |||
| 2017-11-07 | 311 | 1 | nan | 4.2 | 2.7 | 3.3 | 0.6 | 9.7 | 6.3 | 5.1 | 4.8 | 14.6 | 3.9 | 9 | 14.8 | 26.6 | 14.8 | 11.6 | 16.8 | |||
| 2017-11-07 | 311 | 2 | nan | 4.2 | 2.4 | 3.6 | 0.6 | 9.7 | 6.6 | 5.1 | 5.1 | 14.6 | 3.4 | 9.2 | 14 | 27.1 | 14.8 | 11.6 | 16.8 | |||
| 2017-11-07 | 311 | Avg | 0-15cm | 0 | 0 | |||||||||||||||||
| 2017-11-07 | 311 | Avg | 15-30cm | 0 | 0 | |||||||||||||||||
| 2017-11-07 | 311 | Avg | 30-45cm | 0 | 0 | |||||||||||||||||
| 2017-11-07 | 311 | Avg | 45-60cm | 0 | 0 |
No TZ grass heigth found
No VR grass heigth found
No VR Tree DBH found
No water potential data found
No VR Grass Biomass data found
No VR OakLeaves Biomass data found
No VR PineNeedles Biomass data found
1 photos found
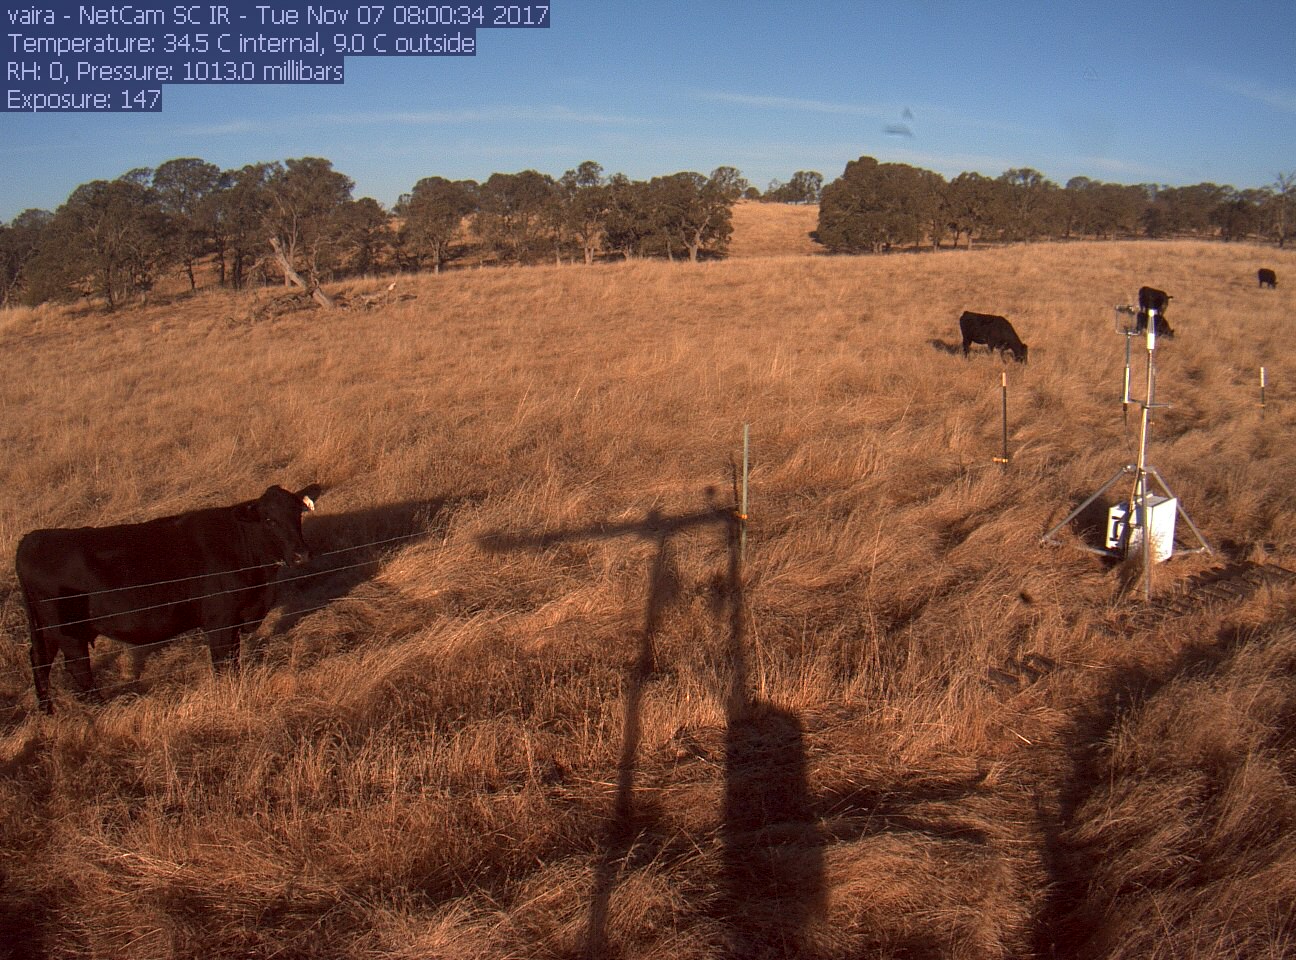
vaira_2017_11_07_080102.jpg ( 2017-11-07 08:01:02 ) Full size: 1296x960
Cows
9 sets found
16 VR_met graphs found
2 VR_flux graphs found
6 VR_soilco2 graphs found
2 VR_pond graphs found
Can't check TZVR_mixed
3 VR_fd graphs found
No data found for VR_processed.
No data found for VR_arable.
No data found for VR_soilvue.